
Chapter 2Microcredit Landscape in India
The financial year 2024–25 proved to be a challenging period for the Indian microfinance industry, characterized by decelerating growth, narrowing profit margins, and intensified regulatory oversight. Despite remaining a vital contributor to financial inclusion, the industry witnessed a significant slowdown, accompanied by rising non-performing assets (NPAs), multiple lending, increased borrower indebtedness, and operational difficulties triggered by regulatory actions in certain states, like Karnataka.

Microcredit Landscape in India
2.1 Industry Overview
The financial year 2024–25 proved to be a challenging period for the Indian microfinance industry, characterized by decelerating growth, narrowing profit margins, and intensified regulatory oversight. Despite remaining a vital contributor to financial inclusion, the industry witnessed a significant slowdown, accompanied by rising non-performing assets (NPAs), multiple lending, increased borrower indebtedness, and operational difficulties triggered by regulatory actions in certain states, like Karnataka.
Moving forward, the industry must emphasize stronger credit underwriting, disciplined lending practices, enhanced client protection, and effective grievance redressal mechanisms to facilitate a robust recovery and growth in FY 2025-26.
This chapter analyzes the overall status of the microfinance industry using data obtained from CRIF Highmark, a leading credit information company. The analysis encompasses information from all microlenders operating nationwide, including Banks, Small Finance Banks (SFBs), NBFCMFIs, NBFCs, and Others1 .
Microfinance Industry Snapshot as of 31st March 2025
| Parameter | Micro-Lender | As of 31st March 2025 | Micro-Lender Share (in %) | Y-o-Y Growth (in %) |
|---|---|---|---|---|
| Loan Outstanding (in ₹ Cr.) | NBFC-MFIs | 1,48,419 | 39% | -18% |
| Banks | 1,24,431 | 32% | -10% | |
| SFBs | 59,817 | 16% | -20% | |
| NBFCs | 45,042 | 12% | 0.2% | |
| Others | 3,516 | 1% | 34% | |
| Industry | 3,81,225 | -14% | ||
| Number of Loan Accounts (in lakhs) | NBFC-MFIs | 539 | 39% | -19% |
| Banks | 466 | 33% | -11% | |
| SFBs | 216 | 15% | -12% | |
| NBFCs | 163 | 12% | -4% | |
| Others | 15 | 1% | 34% | |
| Industry | 1,399 | -13% | ||
| Amount Disbursed during the FY 2024-25 (in ₹ Cr.) | NBFC-MFIs | 1,07,184 | 38% | -25% |
| Banks | 1,08,159 | 38% | -27% | |
| SFBs | 36,936 | 13% | -36% | |
| NBFCs | 31,567 | 11% | -13% | |
| Others | 284 | 0.1% | -71% | |
| Industry | 2,84,130 | -26% |
1 Others refer to Cooperative Banks, Local Area Banks, Sec. 8 Companies, Nidhi Companies, etc.
Source: CRIF Highmark
2.1.1 Key Performance Highlights
- Loan Outstanding: As of March 31, 2025, the total microloan outstanding across all micro-lenders stood at ₹3,81,225 Cr., reflecting a year-on-year decline of 14%. NBFC-MFIs continued to remain the largest provider of microcredit, accounting for 39% of the total market share, followed by Banks at 32%. Small Finance Banks (SFBs), NBFCs, and Others represented 16%, 12%, and 1% of the market share, respectively.
- Loan Accounts and Unique Active Borrowers: By the end of March 2025, micro-lenders together serviced around 1,399 lakhs loan accounts spanning over 750 districts, registering a year-on-year decrease of 13%. The number of unique active borrowers was 828 lakhs, marking a 5% decline compared to the last financial year. The top five states collectively accounted for 54% of the industry loan accounts.
- Disbursement and Lending: During FY 2024-25, all micro-lenders collectively disbursed ₹2,84,130 Cr. through 553 lakh loan accounts, compared to ₹3,86,287 Cr. disbursed through 836 lakh loan accounts in FY 2023-24. This represents a year-on-year decline of 26%, reflecting a more cautious lending approach by microfinance institutions in response to a lack of funding support, and rising delinquencies.
- Asset Quality:There had been deterioration in the portfolio quality under all buckets, i.e., PAR 30 (30-179 dpd), PAR 60 (60-179 dpd), PAR 90 (90-179 dpd), and PAR 180 (180+ dpd) as of 31st March 2025, as compared to the position in the previous financial year, with PAR 30+ dpd surging to 6.2%, up significantly from 2.1% in the last financial year. There were several factors disrupting the borrower’s repayment capacity, including an economic slowdown, increased borrower indebtedness, rural distress, climate change events, natural disasters, and a prolonged general election.
- Average Balance per Loan Account: The average balance per loan account for the microfinance industry was at ₹27,251 as on 31st March 2025, as against ₹27,441 at the end of the FY 24, registering a Y-o-Y degrowth of 1%. The number remained almost the same, as the percentage reduction in the overall loan outstanding and the number of loan accounts was almost the same. In Y-o-Y comparison, the average balance per loan account had increased for all micro-lenders, except for SFBs, which recorded a negative growth of 9.4%, causing an overall slight reduction.
- Average Ticket Size (ATS): Despite the slowdown in disbursements, the average loan amount disbursed per account increased by about 11% in FY 2024-25, reaching ₹51,369. This indicated that while new loan sanctions were fewer, the sanction of the loan was more selective, with a higher value of each loan.
2.2 Loan Accounts
2.1.1 Key Performance Highlights
Figure 2.1 Market Share of Micro-Lenders in terms of Loan Accounts (in %)
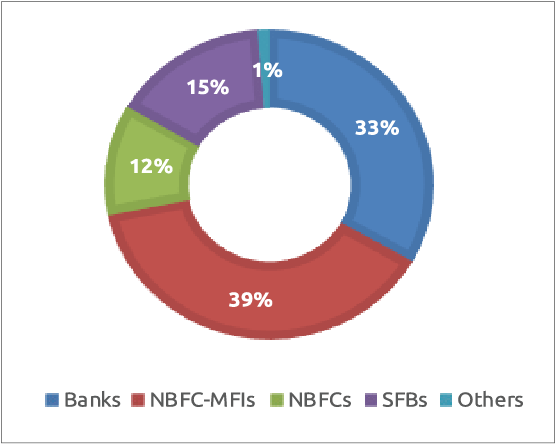
As of March 31, 2025, the total number of loan accounts serviced by all micro-lenders stood at 1,399 lakhs. The NBFC-MFIs maintained the largest market share with 539 lakh loan accounts, representing 39%, followed by Banks with 466 lakh loan accounts (33%). Small Finance Banks (SFBs) serviced 216 lakh loan accounts (15%), NBFCs accounted for 163 lakh loan accounts (12%), and Other lenders comprised 15 lakh loan accounts (1%). On a year-on-year basis, only the ‘Others’ category registered positive growth in loan accounts at 34%, whereas all other microlender categories experienced declines: NBFC-MFIs (-19%), SFBs (-12%), Banks (-11%), and NBFCs (-4%).
Figure 2.2: Y-o-Y Growth (in %) in Number of Loan Accounts across micro-lenders (in lakhs)

The contraction in loan accounts during FY 2024-25 reflected a deliberate recalibration by micro-lenders facing elevated credit risks within the microfinance industry. After an extended period of accelerated growth, rising delinquency rates signalled emerging vulnerabilities, prompting the micro lenders to shift towards more prudent, quality-centric lending practices. This transition resulted in both a reduction in the number of disbursed loans and a decrease in total outstanding loan balances, as lenders prioritized risk management and the long-term stability of their portfolios.
This change was also prompted by the guardrails issued by SROs like Sa-Dhan for reducing the overleverage and bringing the industry back to a better shape. As a result of this, there has been an improvement in terms of the number of micro-lenders for a borrower, which can be observed in Table 2.1.
Table 2.1 Distribution of Unique Active Borrowers across the number of micro-lenders as of March 2025 and March 2024
| Active Lender Associations | Unique Active Borrowers (in %) as on March 2025 | Unique Active Borrowers (in %) as on March 2024 |
|---|---|---|
| <=2 | 88.3% | 85.8% |
| 3 | 7.2% | 7.8% |
| 4 | 2.9% | 3.6% |
| >=5 | 1.6% | 2.8% |
2.2.2 State/UT-wise No. of Loan Accounts (in lakhs)
Table 2.2 depicts the loan accounts serviced across various States and Union Territories. A year-on-year analysis indicates that 32 States and UTs experienced a decline in the number of loan accounts. In contrast, four North Eastern states—Nagaland (29%), Arunachal Pradesh (17%), Meghalaya (5%), and Assam (1%)—registered an increase, although their overall share in the microfinance industry remains minimal. Notably, the principal states with the highest loan outstanding, including Tamil Nadu (-20%), Karnataka (-12%), Bihar (-9%), Uttar Pradesh (-8%), and West Bengal (-8%), saw a contraction in the number of loan accounts, reflecting broad-based negative growth in these key states.
Table 2.2 Loan Accounts (in lakhs) of all micro-lenders across States/UTs – March 2025 and March 2024 (in descending order of Loan Accounts)
| S. No. | State/UT | March 2025 (in lakhs) |
March 2024 (in lakhs) |
Y-o-Y Growth (in %) |
|---|---|---|---|---|
| 1 | Bihar | 202.32 | 221.75 | -9% |
| 2 | Tamil Nadu | 151.63 | 188.42 | -20% |
| 3 | Uttar Pradesh | 151.16 | 163.74 | -8% |
| 4 | Karnataka | 126.50 | 143.91 | -12% |
| 5 | West Bengal | 122.92 | 132.99 | -8% |
| 6 | Maharashtra | 111.30 | 124.70 | -11% |
| 7 | Odisha | 83.81 | 98.05 | -15% |
| 8 | Madhya Pradesh | 81.09 | 93.46 | -13% |
| 9 | Rajasthan | 56.33 | 67.83 | -17% |
| 10 | Andhra Pradesh | 50.01 | 68.65 | -27% |
| 11 | Jharkhand | 42.64 | 49.15 | -13% |
| 12 | Gujarat | 40.90 | 46.68 | -12% |
| 13 | Kerala | 40.47 | 48.83 | -17% |
| 14 | Telangana | 29.55 | 39.67 | -26% |
| 15 | Assam | 25.89 | 25.65 | 1% |
| 16 | Chhattisgarh | 24.43 | 28.16 | -13% |
| 17 | Haryana | 18.67 | 22.98 | -19% |
| 18 | Punjab | 17.44 | 23.89 | -27% |
| 19 | Tripura | 6.74 | 7.18 | -6% |
| 20 | Uttarakhand | 6.27 | 7.30 | -14% |
| 21 | Puducherry | 2.20 | 2.71 | -19% |
| 22 | Delhi | 2.15 | 2.67 | -20% |
| 23 | Goa | 0.60 | 0.67 | -12% |
| 24 | Himachal Pradesh | 0.56 | 0.64 | -12% |
| 25 | Meghalaya | 0.52 | 0.50 | -5% |
| 26 | Others | 0.52 | 0.71 | -28% |
| 27 | Mizoram | 0.43 | 0.43 | -1% |
| 28 | Sikkim | 0.40 | 0.42 | -6% |
| 29 | Manipur | 0.38 | 0.46 | -18% |
| 30 | Arunachal Pradesh | 0.35 | 0.30 | 17% |
| 31 | Jammu & Kashmir | 0.27 | 0.28 | -1% |
| 32 | Nagaland | 0.21 | 0.16 | 29% |
| 33 | Chandigarh | 0.18 | 0.21 | -16% |
| 34 | Andaman and Nicobar Islands | 0.05 | 0.05 | -1% |
| 35 | Dadra and Nagar Haveli | 0.04 | 0.05 | -13% |
| 36 | Daman and Diu | 0.02 | 0.03 | -11% |
| 37 | Lakshadweep | 0.00 | 0.00 | -25% |
| Industry | 1,399 | 1,613 | -13% |
Table 2.3 No. of Unique Active Borrowers, Loan Accounts, Share of Unique Accounts, and Loan Outstanding vs Active Lender Associations as of March 2025
| Active Lender Associations | No. of Unique Active Borrowers (in Lakhs) | Share of Unique Accounts (in %) | No. of Loan Accounts (in Lakhs) | Loan Outstanding (in ₹ Cr.) |
|---|---|---|---|---|
| <=2 | 731 | 88.3 | 1,014 | 2,78,787 |
| 3 | 59 | 7.2 | 199 | 56,069 |
| 4 | 24 | 2.9 | 107 | 27,742 |
| >=5 | 13 | 1.6 | 79 | 18,627 |
| Industry | 828 | 1,399 | 3,81,225 |
It can be observed from Table 2.3 above that the majority share of the unique active borrowers, industry loan outstanding, and loan accounts is concentrated within the bucket of less than 2 active micro-lenders. The guardrails introduced by the SROs, such as capping the number of micro-lenders at 3 micro-lenders, the total credit exposure of a borrower at ₹2 lakhs, among others, have reduced risk and contributed to more sustainable microfinance operations.
2.3 Loan Outstanding Analysis
2.3.1 Loan Outstanding (in ₹ Cr.)2
Figure 2.3: Loan Outstanding (in ₹ Cr.) across micro-lenders

2 Off-balance sheet (managed, assigned, and business correspondent) loan outstanding of NBFC-MFIs, NBFCs, and Non-Profit MFIs is included under the Bank’s category
At the close of FY 2024-25, the total microcredit loan outstanding across all micro-lenders was ₹3,81,225 Cr., reflecting a year-on-year decline of 14%. Most of the micro-lenders reported negative growth during the reporting period, with the Small Finance Banks (SFBs) experiencing the steepest decline at 20%, followed by NBFC-MFIs at 18% and Banks at 10%. Conversely, non-NBFC-MFIs and NBFCs reported positive growth of 34% and 0.2%, respectively. The overall reduction in loan outstanding was driven not by a decrease in demand but by a deliberate attempt by the lenders due to significant repayment stress and a strategic shift toward cautious risk management. This included measures such as restrictions on multiple lending, enhanced credit assessments, and liquidity crunch during FY 2024-25.
2.3.2 State/UT-wiseLoanOutstanding(in₹Cr.)
Table 2.4 outlines the loan outstanding across States and Union Territories. Year-on-year analysis reveals that 32 States/UTs experienced a decline in loan outstanding during the period. Only four states with relatively smaller microfinance footprints—Arunachal Pradesh (29%), Nagaland (24%), Telangana (14%), and Meghalaya (8%)—recorded positive growth.
In contrast, major states with significant loan outstanding, including Tamil Nadu (-20%), Karnataka (-17%), Bihar (-12%), Uttar Pradesh (-10%), and West Bengal (-9%), witnessed substantial declines. The widespread stress in the microfinance industry, primarily driven by credit overexposure and related recovery challenges, led to a reduction in fresh credit disbursements and, consequently, a decrease in loan outstanding
Furthermore, the state-level regulatory interventions— such as the Karnataka Micro Loan and Small Loan (Prevention of Coercive Actions) Bill, 2025, created some apprehension among the lenders regarding potential operational constraints and increased compliance requirements.
Table 2.4 Loan Outstanding (in ₹ Cr.) of all micro-lenders across States/UTs - March 2025 and March 2024 (in descending order of Loan Outstanding)
| S. No | State/UT | March 2025 (in ₹ Cr.) |
March 2024 (in ₹ Cr.) |
Y-o-Y Growth (in %) |
|---|---|---|---|---|
| 1 | Bihar | 57,712 | 65,487 | -12% |
| 2 | Tamil Nadu | 46,833 | 58,239 | -20% |
| 3 | Uttar Pradesh | 41,774 | 46,304 | -10% |
| 4 | West Bengal | 36,730 | 40,328 | -9% |
| 5 | Karnataka | 35,351 | 42,560 | -17% |
| 6 | Maharashtra | 29,596 | 33,304 | -11% |
| 7 | Madhya Pradesh | 21,653 | 24,870 | -13% |
| 8 | Odisha | 20,719 | 25,615 | -19% |
| 9 | Rajasthan | 14,930 | 18,144 | -18% |
| 10 | Kerala | 11,273 | 14,159 | -20% |
| 11 | Jharkhand | 11,149 | 13,118 | -15% |
| 12 | Gujarat | 10,913 | 13,107 | -17% |
| 13 | Andhra Pradesh | 7,322 | 8,346 | -12% |
| 14 | Assam | 7,082 | 7,410 | -4% |
| 15 | Chhattisgarh | 6,553 | 7,493 | -11% |
| 16 | Telangana | 5,717 | 5,015 | 14% |
| 17 | Haryana | 5,138 | 6,236 | -18% |
| 18 | Punjab | 4,372 | 5,684 | -23% |
| 19 | Tripura | 2,196 | 2,314 | -6% |
| 20 | Uttarakhand | 1,749 | 2,077 | -16% |
| 21 | Puducherry | 671 | 842 | -20% |
| 22 | Delhi | 616 | 795 | -23% |
| 23 | Himachal Pradesh | 160 | 182 | -12% |
| 24 | Goa | 155 | 195 | -21% |
| 25 | Meghalaya | 139 | 129 | 8% |
| 26 | Sikkim | 131 | 133 | -1% |
| 27 | Mizoram | 111 | 121 | -9% |
| 28 | Arunachal Pradesh | 105 | 81 | 29% |
| 29 | Others | 90 | 172 | -48% |
| 30 | Jammu & Kashmir | 80 | 83 | -4% |
| 31 | Manipur | 80 | 104 | -23% |
| 32 | Nagaland | 68 | 55 | 24% |
| 33 | Chandigarh | 46 | 54 | -15% |
| 34 | Andaman and Nicobar Islands | 18 | 20 | -9% |
| 35 | Dadra and Nagar Haveli | 14 | 16 | -12% |
| 36 | Daman and Diu | 7 | 9 | -20% |
| 37 | Lakshadweep | 0.02 | 0.03 | -39% |
| Industry | 3,81,225 | 4,42,700 | -14% |
Figure 2.4: Market Share of micro-lenders in terms of Loan Outstanding (in %)

In terms of market share of loan outstanding, NBFC-MFIs remained the dominant providers of microcredit, accounting for 39% of the total market. Banks held the second-largest share at 32%, followed by Small Finance Banks (SFBs) with 16%, NBFCs with 12%, and Others comprising the remaining 1%.
2.3.3 State/UT-wise Loan Outstanding per Unique Active Borrowers (in ₹)
Table 2.5 provides data on loan outstanding per unique active borrowers across States and Union Territories, showing an overall year-on-year decrease of 10%. This decline is largely attributable to a more cautious and risklimiting stance adopted by micro-lenders in response to rising delinquencies and increased borrower leverage. Additional contributing factors include regulatory measures imposed by self-regulatory organizations, such as restrictions on the number of micro-lenders and caps on combined microfinance and retail (unsecured) loan exposure for households, which is not to exceed ₹2 lakhs.
Table 2.5 Loan Outstanding per Unique Active Borrowers across States/UTs (in ₹) - March 2025 and March 2024 (in descending order of Loan Outstanding per Unique Active Borrowers)
| S. No | State/UT | March 2025 (in ₹) |
March 2024 (in ₹) |
Y-o-Y Growth (in %) |
|---|---|---|---|---|
| 1 | Karnataka | 56,362 | 64,925 | -13% |
| 2 | Puducherry | 55,327 | 65,511 | -16% |
| 3 | Tamil Nadu | 54,776 | 62,807 | -13% |
| 4 | Bihar | 51,136 | 59,885 | -15% |
| 5 | Kerala | 50,968 | 63,826 | -20% |
| 6 | West Bengal | 47,973 | 52,251 | -8% |
| 7 | Goa | 47,633 | 54,891 | -13% |
| 8 | Tripura | 47,511 | 50,321 | -6% |
| 9 | Maharashtra | 47,091 | 50,897 | -7% |
| 10 | Jharkhand | 46,446 | 53,636 | -13% |
| 11 | Arunachal Pradesh | 45,962 | 41,109 | 12% |
| 12 | Odisha | 45,956 | 55,495 | -17% |
| 13 | Dadra and Nagar Haveli | 45,316 | 78,249 | -42% |
| 14 | Uttar Pradesh | 44,949 | 50,674 | -11% |
| 15 | Jammu & Kashmir | 43,378 | 45,016 | -4% |
| 16 | Daman and Diu | 43,199 | 1,25,812 | -66% |
| 17 | Uttarakhand | 42,798 | 48,560 | -12% |
| 18 | Chhattisgarh | 42,695 | 45,277 | -6% |
| 19 | Haryana | 42,375 | 47,611 | -11% |
| 20 | Madhya Pradesh | 42,239 | 46,344 | -9% |
| 21 | Nagaland | 42,152 | 39,504 | 7% |
| 22 | Rajasthan | 41,364 | 47,192 | -12% |
| 23 | Gujarat | 40,747 | 47,948 | -15% |
| 24 | Sikkim | 40,624 | 41,890 | -3% |
| 25 | Himachal Pradesh | 39,867 | 43,301 | -8% |
| 26 | Andaman and Nicobar Islands | 39,006 | 41,657 | -6% |
| 27 | Punjab | 38,568 | 42,901 | -10% |
| 28 | Chandigarh | 36,618 | 39,493 | -7% |
| 29 | Delhi | 35,139 | 39,346 | -11% |
| 30 | Assam | 33,844 | 37,602 | -10% |
| 31 | Lakshadweep | 32,741 | 53,477 | -39% |
| 32 | Meghalaya | 31,852 | 31,454 | 1% |
| 33 | Mizoram | 30,455 | 32,032 | -5% |
| 34 | Telangana | 27,165 | 17,378 | 56% |
| 35 | Manipur | 22,988 | 24,798 | -7% |
| 36 | Andhra Pradesh | 22,176 | 18,002 | 23% |
| 37 | Others | 21,303 | 35,207 | -39% |
| Industry | 46,064 | 51,051 | -10% |
On a year-on-year comparison, 31 States and Union Territories recorded a decline in loan outstanding per borrower, with the exception of five states with relatively limited microfinance market presence i.e., Telangana (56%), Andhra Pradesh (23%), Arunachal Pradesh (12%), Nagaland (7%), and Meghalaya (1%)—which experienced increases. In contrast, key states with substantial loan outstanding, such as Bihar (-15%), Tamil Nadu and Karnataka (-13% each), Uttar Pradesh (-11%), and West Bengal (-8%), witnessed notable declines in loan outstanding per borrower
Table 2.6 Distribution of industry loan outstanding (in ₹ Cr.) across active lenders and borrowers’ credit exposure as of March 2025
The following table depicts the distribution of loan outstanding (in ₹ Cr.) across different numbers of active lenders and borrowers’ credit exposure:
| Active Lenders/ Borrower Credit Exposure | < ₹1 Lakh | ₹1 Lakh–₹1.25 Lakh | ₹1.25 Lakh–₹1.5 Lakh | ₹1.5 Lakh+ |
|---|---|---|---|---|
| < 2 lenders | 2,31,500 | 26,083 | 12,065 | 9,139 |
| 3 lenders | 21,399 | 13,233 | 10,134 | 11,303 |
| 4 lenders | 6,136 | 6,041 | 6,095 | 9,470 |
| 5 lenders | 1,807 | 2,639 | 3,463 | 10,718 |
It can be observed from Table 2.6 above that the majority of the industry loan outstanding, i.e., 61% is concentrated within the bucket of less than 2 active micro-lenders and having a credit exposure of less than ₹1 lakh. The guardrails introduced by the SROs, such as capping the number of micro-lenders at 3 micro-lenders, the total credit exposure of a borrower at ₹2 lakhs, among others, and complemented by the RBI regulations, forms part of a broader framework aimed at ensuring responsible lending, strengthening borrower protection etc. which have limited the borrowers’ credit exposure, thereby reducing risk and contributing to more sustainable microfinance operations.
Figure 2.5: Regional distribution of Loan Outstanding (in %)

In terms of regional distribution of loan outstanding, the Eastern region—comprising Bihar, Odisha, Jharkhand, West Bengal, and Andaman & Nicobar Islands—led with a 33% market share. This was followed by the Southern region, which includes Andhra Pradesh, Karnataka, Kerala, Tamil Nadu, Telangana, Puducherry, and Lakshadweep, accounting for 28%. The Central region, consisting of Madhya Pradesh, Uttar Pradesh, Chhattisgarh, and Uttarakhand, held 18% of the market share. The Western region, covering Gujarat, Maharashtra, Goa, and Dadra & Nagar Haveli and Daman & Diu, contributed 11%, while the Northern region— encompassing Delhi, Haryana, Rajasthan, Punjab, Chandigarh, Himachal Pradesh, Jammu & Kashmir, and Ladakh—accounted for 7%. The Northeastern states, including Assam, Manipur, Tripura, Nagaland, Sikkim, Meghalaya, Mizoram, and Arunachal Pradesh, had the smallest share at 3%.
2.3.4 State/UT-wise Average Balance per Loan Account (in ₹)
The State and Union Territory-wise average balance per loan account is detailed in Table 2.7. As of March 31, 2025, the overall average balance per loan account in the microfinance industry stood at ₹27,251, reflecting a year-on-year decline of 1% from ₹27,441 recorded on March 31, 2024.
On a Y-o-Y comparison, 25 States and UTs experienced a decrease in average balance per loan account. Notable declines were observed in key states with significant loan outstanding, including Karnataka (-6%), Bihar (-3%), Uttar Pradesh (-2%), West Bengal (-1%), and Tamil Nadu (-0.1%).
Table 2.7: Average Balance per Loan Account (in ₹) - March 2025 and March 2024 (in descending order of Average Balance per Loan Account)
| S. No | State/UT | March 2025 (in ₹) |
March 2024 (in ₹) |
Y-o-Y Growth (in %) |
|---|---|---|---|---|
| 1 | Andaman and Nicobar Islands | 34,230 | 36,859 | -7% |
| 2 | Dadra and Nagar Haveli | 34,177 | 33,884 | 1% |
| 3 | Nagaland | 33,213 | 34,081 | -3% |
| 4 | Sikkim | 33,173 | 31,711 | 5% |
| 5 | Tripura | 32,171 | 32,227 | 0% |
| 6 | Tamil Nadu | 30,886 | 30,909 | 0% |
| 7 | Puducherry | 30,452 | 31,006 | -2% |
| 8 | Arunachal Pradesh | 30,257 | 27,420 | 10% |
| 9 | West Bengal | 29,880 | 30,324 | -1% |
| 10 | Jammu & Kashmir | 29,298 | 30,143 | -3% |
| 11 | Delhi | 28,653 | 29,738 | -4% |
| 12 | Daman & Diu | 28,632 | 32,106 | -11% |
| 13 | Bihar | 28,525 | 29,532 | -3% |
| 14 | Himachal Pradesh | 28,425 | 28,487 | 0% |
| 15 | Karnataka | 27,946 | 29,574 | -6% |
| 16 | Uttarakhand | 27,885 | 28,441 | -2% |
| 17 | Kerala | 27,855 | 28,995 | -4% |
| 18 | Uttar Pradesh | 27,636 | 28,279 | -2% |
| 19 | Haryana | 27,517 | 27,144 | 1% |
| 20 | Assam | 27,359 | 28,892 | -5% |
| 21 | Chhattisgarh | 26,823 | 26,238 | 2% |
| 22 | Madhya Pradesh | 26,702 | 26,610 | 0% |
| 23 | Meghalaya | 26,702 | 25,998 | 3% |
| 24 | Gujarat | 26,679 | 28,077 | -5% |
| 25 | Maharashtra | 26,592 | 26,708 | 0% |
| 26 | Rajasthan | 26,505 | 26,751 | -1% |
| 27 | Jharkhand | 26,145 | 26,689 | -2% |
| 28 | Mizoram | 26,053 | 26,189 | -8% |
| 29 | Chandigarh | 25,944 | 25,524 | 2% |
| 30 | Goa | 25,912 | 28,939 | -10% |
| 31 | Punjab | 25,071 | 23,796 | 5% |
| 32 | Odisha | 24,720 | 26,123 | -5% |
| 33 | Lakshadweep | 21,827 | 26,738 | -18% |
| 34 | Manipur | 21,194 | 22,540 | -6% |
| 35 | Telangana | 19,348 | 12,643 | 53% |
| 36 | Others | 17,445 | 24,192 | -28% |
| 37 | Andhra Pradesh | 14,642 | 12,157 | 20% |
| Industry | 27,251 | 27,441 | -1% |
2.3.5 Top States and Districts in terms of Loan Outstanding:
The top 10 States and top 25 districts in terms of total loan outstanding at the end of the FY 2024-25 are given in Table 2.8 and Table 2.9, respectively. Bihar continues to be the top state in terms of loan outstanding, and the top 5 states continue to be the same for the last two years.
Table 2.8: Top 10 States in terms of Loan Outstanding (in ₹ Cr.)
| Microfinance Industry – all micro-lenders | |
|---|---|
| State | Loan Outstanding (in ₹ Cr.) |
| Bihar | 57,712 |
| Tamil Nadu | 46,833 |
| Uttar Pradesh | 41,774 |
| West Bengal | 36,730 |
| Karnataka | 35,351 |
| Maharashtra | 29,596 |
| Madhya Pradesh | 21,653 |
| Odisha | 20,719 |
| Rajasthan | 14,930 |
| Kerala | 11,273 |
The top 10 states accounted for 83% of the share in the industry loan outstanding, while the top 5 states alone accounted for 57% of the industry loan outstanding.
Similarly, the loan outstanding of the top 25 districts in the country is mapped and given below. This data is the cumulative outstanding of various micro lenders as of 31 March 2025 in these 25 districts.
Table 2.9 Top 25 Districts in terms of Loan Outstanding (in ₹ Cr.)
| Microfinance Industry – all micro-lenders | ||
|---|---|---|
| State | District | Loan Outstanding (in ₹ Cr.) |
| West Bengal | Murshidabad | 4,239 |
| Bihar | East Champaran | 3,855 |
| Bihar | Muzaffarpur | 3,681 |
| Bihar | Samastipur | 3,655 |
| West Bengal | North 24 Parganas | 3,154 |
| Karnataka | Mysuru | 3,081 |
| Bihar | Madubani | 3,036 |
| Karnataka | Belagavi | 2,867 |
| Bihar | Darbhanga | 2,715 |
| Tamil Nadu | Cuddalore | 2,703 |
| West Bengal | South 24 Parganas | 2,657 |
| Bihar | West Champaran | 2,597 |
| Bihar | Aurangabad | 2,396 |
| Tamil Nadu | Thanjavur | 2,365 |
| Bihar | Purnia | 2,317 |
| Bihar | Sitamarhi | 2,315 |
| Bihar | Begusarai | 2,279 |
| Karnataka | Tumkur | 2,242 |
| Bihar | Vaishali | 2,242 |
| West Bengal | Nadia | 2,215 |
| Tamil Nadu | Salem | 2,201 |
| Uttar Pradesh | Gorakhpur | 2,156 |
| West Bengal | Howrah | 2,133 |
| West Bengal | Hooghly | 2,101 |
| Maharashtra | Nagpur | 2,091 |
The top 25 districts by loan outstanding included 11 districts from Bihar, 6 from West Bengal, 3 from Tamil Nadu, 3 from Karnataka, and one each from Maharashtra and Uttar Pradesh. All these districts had loan outstanding exceeding ₹2,000 Cr., with 7 districts surpassing ₹3,000 Cr. Murshidabad district in West Bengal recorded the highest loan outstanding, exceeding ₹4,000 Cr. The combined loan outstanding of the top 25 districts accounted for 18% of the industry loan outstanding, while the top 10 districts alone contributed 9%. A notable decline was observed in the number of districts with loan outstanding greater than ₹2,000 Cr., falling from 41 as of March 31, 2024, to 29 as of March 31, 2025.
2.4 Asset Quality and Delinquency Overview
2.4.1 Delinquency (in %)
This section discusses the delinquency in the microfinance industry during FY 2024-25, expressed in terms of Portfolio at Risk (PAR) for varying buckets. The PAR 30+ dpd surged to 6.2%, up significantly from 2.1% in the last financial year. The delinquency under various buckets depicted in the table below indicates that PAR under all buckets had deteriorated.
Table 2.10 Delinquency (in %) under various buckets for Industry as of March 2025 and March 2024
| PAR bucket (in %) | Mar-25 | Mar-24 |
|---|---|---|
| PAR 30-179 dpd | 6.2% | 2.1% |
| PAR 60-179 dpd | 4.8% | 1.6% |
| PAR 90-179 dpd | 3.5% | 0.9% |
| PAR 180+ dpd | 12.6% | 9.6% |
State-wise data further corroborate this upward trend in delinquency across the industry. Detailed delinquency percentages by various buckets for each State and Union Territory are provided in Table 2.11.
Table 2.11: States/UTs-wise overall delinquency (in %) under different buckets as of March 2025 (in descending order of Loan Outstanding)
| S. No. | State/UT | Loan Outstanding (in ₹ Cr.) |
PAR 30-179 dpd (in %) |
PAR 60-179 dpd (in %) |
PAR 90-179 dpd (in %) |
PAR 180+ dpd (in %) |
|---|---|---|---|---|---|---|
| 1 | Bihar | 57,712 | 7.2% | 6.0% | 4.6% | 8.3% |
| 2 | Tamil Nadu | 46,833 | 6.6% | 5.3% | 3.6% | 10.0% |
| 3 | Uttar Pradesh | 41,774 | 6.8% | 5.5% | 4.1% | 10.6% |
| 4 | West Bengal | 36,730 | 3.2% | 2.6% | 1.8% | 10.5% |
| 5 | Karnataka | 35,351 | 10.2% | 5.7% | 3.7% | 7.1% |
| 6 | Maharashtra | 29,596 | 4.1% | 3.3% | 2.4% | 14.3% |
| 7 | Madhya Pradesh | 21,653 | 5.6% | 4.5% | 3.3% | 15.6% |
| 8 | Odisha | 20,719 | 8.5% | 7.1% | 5.5% | 17.4% |
| 9 | Rajasthan | 14,930 | 5.9% | 4.7% | 3.5% | 15.7% |
| 10 | Kerala | 11,273 | 4.8% | 3.9% | 2.2% | 19.0% |
| 11 | Jharkhand | 11,149 | 7.0% | 5.9% | 4.6% | 14.8% |
| 12 | Gujarat | 10,913 | 7.6% | 5.9% | 4.4% | 13.5% |
| 13 | Andhra Pradesh | 7,322 | 4.9% | 3.4% | 2.2% | 27.8% |
| 14 | Assam | 7,082 | 1.0% | 0.7% | 0.6% | 29.7% |
| 15 | Chhattisgarh | 6,553 | 6.0% | 5.2% | 4.0% | 13.6% |
| 16 | Telangana | 5,717 | 2.2% | 1.5% | 1.0% | 18.2% |
| 17 | Haryana | 5,138 | 3.7% | 3.0% | 2.1% | 15.0% |
| 18 | Punjab | 4,372 | 2.4% | 1.8% | 1.3% | 28.2% |
| 19 | Tripura | 2,169 | 3.1% | 2.3% | 1.4% | 9.7% |
| 20 | Uttarakhand | 1,749 | 4.7% | 3.8% | 2.7% | 13.4% |
| 21 | Puducherry | 671 | 5.2% | 4.1% | 2.9% | 10.9% |
| 22 | Delhi | 616 | 3.5% | 2.8% | 1.9% | 21.3% |
| 23 | Himachal Pradesh | 160 | 2.1% | 1.6% | 1.1% | 6.6% |
| 24 | Goa | 155 | 3.7% | 2.9% | 2.0% | 7.9% |
| 25 | Meghalaya | 139 | 1.0% | 0.6% | 0.3% | 16.7% |
| 26 | Sikkim | 131 | 6.4% | 4.0% | 1.1% | 13.2% |
| 27 | Mizoram | 111 | 1.9% | 1.4% | 0.9% | 5.9% |
| 28 | Arunachal Pradesh | 105 | 0.5% | 0.2% | 0.1% | 3.2% |
| 29 | Others | 90 | 8.9% | 6.3% | 5.5% | 22.7% |
| 30 | Jammu & Kashmir | 80 | 4.8% | 3.4% | 1.8% | 5.2% |
| 31 | Manipur | 80 | 5.0% | 4.1% | 3.1% | 71.4% |
| 32 | Nagaland | 68 | 0.3% | 0.3% | 0.2% | 3.5% |
| 33 | Chandigarh | 46 | 3.3% | 2.5% | 1.8% | 20.4% |
| 34 | Andaman and Nicobar Islands | 18 | 0.4% | 0.3% | 0.2% | 3.1% |
| 35 | Dadra and Nagar Haveli | 14 | 3.2% | 2.4% | 1.8% | 13.1% |
| 36 | Daman and Diu | 7 | 4.3% | 3.4% | 2.7% | 8.5% |
| 37 | Lakshadweep | 0.02 | 0.1% | 0.1% | 0.1% | 93.7% |
| Industry | 3,81,225 | 6.2% | 4.8% | 3.5% | 12.6% |
Delinquency levels have risen across the industry. States with significant loan outstanding, such as Rajasthan (5.9%), Madhya Pradesh (5.6%), Andhra Pradesh (4.9%), Kerala (4.8%), Maharashtra (4.1%), West Bengal (3.2%), and Telangana (2.2%), reported below the industry PAR 30+ dpd average of 6.2%. In contrast, major states including Karnataka (10.2%), Odisha (8.5%), Bihar (7.2%), Uttar Pradesh (6.8%), and Tamil Nadu (6.6%) exhibited PAR 30+ levels exceeding the industry average. The elevated PAR 180+ values primarily reflect loans that have become Non-Performing Assets (NPAs) over a period of time, and continued to be reported as receivables in credit bureau records. The PAR 180+ dpd for the last 3 years is at 9.6% (March 2024), 9.1% (March 2023), and 8.4% (March 2022), respectively.
Table 2.12 Area-wise segregation of No. of Loan Accounts, Unique Active Borrowers, Loan Outstanding, and PAR under different buckets
| Area | No. of Loan Accounts (in Lakhs) |
No. of Unique Active Borrowers (in Lakhs) |
Loan Outstanding (in ₹ Cr.) |
PAR 30-179 dpd (in %) |
PAR 60-179 dpd (in %) |
PAR 90-179 dpd (in %) |
PAR 180+ dpd (in %) |
|---|---|---|---|---|---|---|---|
| Rural | 837 | 490 | 2,32,046 | 6.4% | 5.0% | 3.7% | 11.5% |
| Semi-Urban | 160 | 95 | 43,042 | 6.1% | 4.5% | 3.2% | 13.1% |
| Urban | 346 | 206 | 92,208 | 6.0% | 4.6% | 3.2% | 14.9% |
| Not Specified | 55 | 36 | 13,928 | 4.3% | 3.3% | 2.3% | 14.4% |
| Total | 1,399 | 828 | 3,81,225 | 6.2% | 4.8% | 3.5% | 12.6% |
As can be observed from Table 2.12 above, more than 60% of the loan outstanding, loan accounts, and unique active borrowers are in rural areas, while 25% are in urban areas, and the remaining 11% in semi-urban areas. A small portion of the loan is not clearly defined. The delinquency under different buckets across the different areas is more or less the same.
2.5 Disbursement Overview
2.5.1 Disbursement Volume (Number of Loans Disbursed)
Figure 2.6 indicates the number of loans disbursed during the financial year 2024-25, compared with the previous financial year. The data reveals a significant decline in loan disbursements, dropping from 836 lakh loans in FY 2023-24 to 553 lakh loans in FY 2024-25, representing a year-on-year decrease of 34%.
Figure 2.6: Number of Loans Disbursed (in lakhs) across micro-lenders

During the financial year 2024-25, the microfinance industry disbursed a total of 553 lakh loans. NBFC-MFIs led the disbursement with 217 lakh loans, constituting 39% of the total. Banks followed closely, disbursing 210 lakh loans and accounting for 38% of the total. Other lenders contributed a minimal share of 0.03%.
All categories of micro-lenders experienced negative year-on-year growth in loan disbursements during FY 2024-25. The steepest decline was observed in the ‘Others’ category with an 89% reduction, followed by Small Finance Banks (SFBs) at 39%, Banks at 34%, NBFC-MFIs at 33%, and NBFCs at 24%. This overall decrease in loan disbursement volume was primarily driven by liquidity crunch, deteriorating asset quality, tightening regulatory measures, and cautious lending approach emphasizing risk management after a phase of rapid expansion and rising defaults.
2.5.2 Loan Amount Disbursed (in ₹ Cr.)
During FY 2024-25, the total loan amount disbursed by all the micro-lenders together declined sharply to ₹2,84,130 Cr., compared to ₹3,86,287 Cr. in FY 2023-24, marking a year-on-year decrease of 26%. The state and Union Territory-wise disbursement figures for FY 2024-25 are detailed in Table 2.13.
Table 2.13 Loan Amount Disbursed (in ₹ Cr.) of all micro-lenders across States/UTs during FY 2024-25 and FY 2023-24 (in descending order of Loan Amount Disbursed)
| S. No. | State/UT | During FY 2024-25 (in ₹ Cr.) |
During FY 2023-24 (in ₹ Cr.) |
Y-o-Y Growth (in %) |
|---|---|---|---|---|
| 1 | Bihar | 46,044 | 62,959 | -27% |
| 2 | Uttar Pradesh | 32,892 | 44,246 | -26% |
| 3 | West Bengal | 31,497 | 36,161 | -13% |
| 4 | Tamil Nadu | 30,808 | 49,957 | -38% |
| 5 | Karnataka | 26,127 | 38,399 | -32% |
| 6 | Maharashtra | 22,437 | 28,195 | -20% |
| 7 | Madhya Pradesh | 16,110 | 20,904 | -23% |
| 8 | Odisha | 14,177 | 22,049 | -36% |
| 9 | Rajasthan | 10,344 | 15,225 | -32% |
| 10 | Jharkhand | 8,732 | 12,315 | -29% |
| 11 | Gujarat | 7,280 | 10,761 | -32% |
| 12 | Kerala | 6,631 | 11,368 | -42% |
| 13 | Assam | 5,089 | 3,922 | 30% |
| 14 | Chhattisgarh | 5,041 | 6,367 | -21% |
| 15 | Andhra Pradesh | 5,009 | 5,056 | -1% |
| 16 | Telangana | 4,855 | 3,314 | 47% |
| 17 | Haryana | 3,478 | 4,771 | -27% |
| 18 | Punjab | 2,572 | 3,871 | -34% |
| 19 | Tripura | 1,876 | 2,207 | -15% |
| 20 | Uttarakhand | 1,297 | 1,843 | -30% |
| 21 | Puducherry | 505 | 745 | -32% |
| 22 | Delhi | 432 | 586 | -26% |
| 23 | Meghalaya | 122 | 104 | 17% |
| 24 | Himachal Pradesh | 116 | 152 | -23% |
| 25 | Goa | 114 | 180 | -36% |
| 26 | Sikkim | 108 | 100 | 8% |
| 27 | Arunachal Pradesh | 96 | 73 | 31% |
| 28 | Mizoram | 95 | 108 | -12% |
| 29 | Nagaland | 76 | 50 | 52% |
| 30 | Jammu & Kashmir | 58 | 69 | -15% |
| 31 | Chandigarh | 31 | 41 | -26% |
| 32 | Others | 30 | 135 | -78% |
| 33 | Manipur | 18 | 16 | 17% |
| 34 | Andaman & Nicobar Islands | 15 | 19 | -21% |
| 35 | Dadra and Nagar Haveli | 13 | 15 | -17% |
| 36 | Daman and Diu | 5 | 8 | -33% |
| 37 | Lakshadweep | 0.00 | 0.03 | -100% |
| Industry | 2,84,130 | 3,86,287 | -26% | |
The top five states in terms of reduction in loan disbursement during FY 2024-25 were Bihar (₹46,044 Cr.), followed by Uttar Pradesh (₹32,892 Cr.), West Bengal (₹31,497 Cr.), Tamil Nadu (₹30,808 Cr.), and Karnataka (₹26,127 Cr.). Collectively, these five states accounted for 59% of the total amount disbursed during the year.
Figure 2.7: Amount Disbursed (in ₹ Cr.) by Micro-Lender

During FY 2024–25, the combined microcredit disbursements by all micro-lenders stood at ₹2,84,130 Cr. Banks led with disbursements of ₹1,08,159 Cr., followed closely by NBFC-MFIs at ₹1,07,184 Cr. Small Finance Banks (SFBs) contributed ₹36,936 Cr., NBFCs ₹31,567 Cr., while other lenders accounted for a marginal ₹284 Cr.
2.6 Borrower Leverage
2.6.1 Average Ticket Size (ATS)
The Average Ticket Size (ATS) in the microfinance industry during FY 2024-25 reached ₹51,369, reflecting an 11% year-on-year growth from ₹46,225 in the previous financial year. Factors such as borrower over-leverage, operational caution, and the pursuit of sustainability in challenging conditions have made the micro-lenders cautious and selective, leading to higher ticket size loans, and hence, there is an upward growth in average ticket size.
As detailed in Table 2.14, the ATS increased year-on-year in 33 States and Union Territories, with only three minor regions—Jammu & Kashmir, Nagaland, and Lakshadweep— registering declines. Among major states with significant loan outstanding, Karnataka led the increase in ATS, with a 15%, followed by Tamil Nadu (13%), Uttar Pradesh (12%), and both Bihar and West Bengal at 11% each.
Table 2.14: Average Ticket size (in ₹)- During FY 2024-25 and FY 2023-24
| S.No. | State/UT | During FY 2024-25 (in ₹) |
During FY 2023-24 (in ₹) |
Y-o-Y Growth (in %) |
|---|---|---|---|---|
| 1 | Andaman & Nicobar Islands | 72,104 | 59,185 | 22% |
| 2 | Andhra Pradesh | 46,710 | 43,270 | 8% |
| 3 | Arunachal Pradesh | 49,798 | 39,651 | 26% |
| 4 | Assam | 46,659 | 44,424 | 5% |
| 5 | Bihar | 51,558 | 46,499 | 11% |
| 6 | Chandigarh | 52,689 | 47,568 | 11% |
| 7 | Chhattisgarh | 47,628 | 42,558 | 12% |
| 8 | Dadra and Nagar Haveli | 62,992 | 58,022 | 9% |
| 9 | Daman and Diu | 53,249 | 50,523 | 5% |
| 10 | Delhi | 58,895 | 51,396 | 15% |
| 11 | Goa | 51,987 | 46,786 | 11% |
| 12 | Gujarat | 50,649 | 46,833 | 8% |
| 13 | Haryana | 53,288 | 49,166 | 8% |
| 14 | Himachal Pradesh | 49,422 | 47,759 | 3% |
| 15 | Jammu & Kashmir | 42,501 | 45,337 | -6% |
| 16 | Jharkhand | 46,897 | 42,998 | 9% |
| 17 | Karnataka | 51,678 | 44,783 | 15% |
| 18 | Kerala | 52,765 | 49,367 | 7% |
| 19 | Lakshadweep | N.A. | 47,584 | N.A. |
| 20 | Madhya Pradesh | 49,125 | 43,608 | 13% |
| 21 | Maharashtra | 49,091 | 43,455 | 13% |
| 22 | Manipur | 35,965 | 35,362 | 2% |
| 23 | Meghalaya | 48,592 | 45,143 | 8% |
| 24 | Mizoram | 49,652 | 45,396 | 9% |
| 25 | Nagaland | 50,033 | 56,763 | -12% |
| 26 | Odisha | 46,848 | 42,732 | 10% |
| 27 | Others | 55,121 | 43,970 | 25% |
| 28 | Puducherry | 65,550 | 56,815 | 15% |
| 29 | Punjab | 51,324 | 44,491 | 15% |
| 30 | Rajasthan | 51,451 | 46,170 | 11% |
| 31 | Sikkim | 58,532 | 53,615 | 9% |
| 32 | Tamil Nadu | 60,448 | 53,279 | 13% |
| 33 | Telangana | 47,373 | 43,874 | 8% |
| 34 | Tripura | 57,619 | 51,879 | 11% |
| 35 | Uttar Pradesh | 49,054 | 43,925 | 12% |
| 36 | Uttarakhand | 52,170 | 47,728 | 9% |
| 37 | West Bengal | 54,505 | 49,058 | 11% |
| Industry | 51,369 | 46,225 | 11% |
Figure 2.8: Top 10 States/UTs in terms of Average Ticket size (ATS)
The top 10 States/UTs in terms of Average Ticket Size are given below:

As can be seen from Figure 2.8, the Average Ticket Size (ATS) among the top 10 States and Union Territories, except Tamil Nadu, West Bengal, and Haryana, the other states and UTs are smaller regions, where the presence of MFIs is relatively limited.
In many of these states and Union Territories, such as Nagaland, Sikkim, and Daman & Diu, the majority of loans are disbursed by Banks and Small Finance Banks (SFBs). This lending pattern likely contributes to the higher Average Ticket Size (ATS) observed in these regions.
2.7 Way Forward for the Microfinance Industry
FY 2024-25 has been one of the most challenging years for the microfinance industry. The beginning of the FY 2025-26 continues to carry some of these challenges, thereby causing discomfort to the various stakeholders, especially the lenders. The positive part is that the stress pattern has started showing a decline, indicating the worst is over, and there could be a reversal in the decline of the loan outstanding witnessed in the previous FY 2024-25, provided adequate funding support is received. Although the pressure on asset quality and profitability may continue for some more time, it is expected that stabilization will happen in the latter half of the year. The strict adherence to regulatory norms, code of conduct, and guardrails is important for long-term stabilization of the microfinance industry.
Microfinance entities will have to act to improve collections, tighten risk controls, lean into digital transformation, and tap into evolving funding frameworks, which can reap future growth opportunities on a long-term basis. The guardrails introduced by the SROs— such as reduced loan limits and caps on overall borrower indebtedness—which, while slowing loan growth, are expected to enhance the microfinance industry’s resilience and responsible lending. The long-term growth of the microfinance industry is expected to hinge on improved customer underwriting, digital adoption, policy interventions, and a renewed focus on responsible lending and improved collection practices. The stress in the industry is seen as a cyclical phase that will require self-correction and continued institutional support to regain stability and growth. Also, the RBI’s recent circular (June 2025), reducing the minimum qualifying assets for NBFC-MFIs from 75% to 60% of total assets, is a positive step. This will allow for greater loan diversity, augmenting credit risk profiles and enabling the micro-lenders to meet other credit requirements of their borrowers.
Capital inflow is an important element for the early stabilization of the industry. The MFIs should also look at the other options of raising funds, including raising funds from the market. Once the capital infusion to the industry normalizes, it is expected to record positive growth, which is likely by the second half of the year.
In conclusion, while the microfinance industry faces headwinds in the near term, particularly concerning asset quality and operational efficiency, the long-term outlook remains positive with a gradual recovery anticipated in FY 2025-26. The way forward involves a strong emphasis on risk management, technological adoption, diversification, and adherence to evolving regulatory frameworks to ensure sustainable and inclusive growth.
Box 2.1: Community Development and Borrower Welfare initiative of Muthoot Microfin Ltd.
A Digital Leap Towards Financial Inclusion and Sustainability
Muthoot Microfin Ltd. is leading a significant digital transformation within the microfinance sector, aiming for an impressive 95% paperless operation. This ambitious goal is being realized through the expanded use of their flagship Mahila Mitra App and streamlined digital onboarding processes. Complementing this shift, Muthoot Microfin has adopted e-signatures and secure, cloud-based document storage across all its operational units, ensuring efficiency, data accuracy, and enhanced security in its transactions and record-keeping.
The Mahila Mitra App itself has undergone substantial enhancements, featuring significant UI improvements and the integration of push notifications to encourage timely loan repayments. To ensure broader accessibility and adoption, the app now boasts a regional language interface, catering to a diverse user base. Beyond facilitating real-time repayment tracking to foster financial discipline, the app also includes built-in financial literacy modules, empowering users to make well-informed borrowing decisions. With 1.79 million downloads and 52% active customers, the app offers a comprehensive suite of services, including digital gold, new offers, a vernacular voice-enabled chatbot (MitraBot), digital loans, UPI payment modes, and grievance redressal, all designed for a seamless customer experience with rapid response times.
Commitment to the welfare of borrowers and their properties
Beyond digital innovation, Muthoot Microfin demonstrates a strong commitment to the welfare and resilience of its borrowers. Their Natural Calamity Insurance program provides essential asset protection against unforeseen events like floods, cyclones, and earthquakes. For a nominal premium, borrowers receive coverage up to ₹1,00,000, safeguarding their businesses and ensuring continuity even in adverse circumstances. Furthermore, the E-Clinics initiative, active in over 700 branches, offers affordable teleconsultation services to borrowers and their families, addressing health, a top priority for their customer base, thereby building loyalty and fostering overall well-being.
Muthoot Micorfin strategically leverages its regulatory approvals to offer comprehensive and accessible solutions. Utilizing their IRDA license, they provide relevant and affordable insurance products that protect borrowers during unexpected life events. Simultaneously, their e-KYC license enables efficient Aadhaar-based authentication, significantly streamlining the customer onboarding process, enhancing data accuracy, and ensuring regulatory compliance. The fully digital loan journey, from application and scoring to e-signing and disbursement, along with penny-drop and instant credit bureau checks via Aadhaar verification, minimizes transaction errors. Additionally, geotagging of customer centers and the use of dynamic QR codes and digital receipts ensure real-time tracking and transparency in operations.
A drive towards eco-conscious practices
Driving sustainability is a core tenet of Muthoot Microfin’s operational philosophy. The organization is actively integrating eco-conscious practices into its daily operations, infrastructure, and lending activities to reduce its carbon footprint.
This includes disbursing ₹27.5 crore in green loans for solar energy and sanitation facilities, transitioning 85% of printers to eco-friendly inkjet models, and enabling 95% digital transactions. Muthoot Microfin has also launched a Green Office Drive, rolled out a Board-approved Climate Risk Framework, and introduced employee EV financing. Furthermore, they are progressively shifting to cleaner energy sources, with solar panels installed at 50 branches generating 14.4 GJ of clean energy, significantly reducing Scope 2 emissions and power costs, leading to an 87% reduction in paper usage