
Chapter 3 - Section 3.4Loan Outstanding
The borrowers typically seek loans for diverse purposes—ranging from emergencies and consumption needs to small businesses, working capital, and housing. Mainstream lenders often hesitate to meet these demands due to the small loan sizes, lack of collateral, and procedural complexities. MLIs have filled this gap, playing a crucial role in serving the financially excluded. Recognizing their importance, the Government of India has partnered with MLIs, particularly NBFC- MFIs and NBFCs, in implementing flagship schemes such as the Pradhan Mantri Mudra Yojana (PMMY) and PMSVANidhi.


3.4 Loan Outstanding
3.4.1 Loan Outstanding of MLIs
The borrowers typically seek loans for diverse purposes—ranging from emergencies and consumption needs to small businesses, working capital, and housing. Mainstream lenders often hesitate to meet these demands due to the small loan sizes, lack of collateral, and procedural complexities. MLIs have filled this gap, playing a crucial role in serving the financially excluded. Recognizing their importance, the Government of India has partnered with MLIs, particularly NBFC- MFIs and NBFCs, in implementing flagship schemes such as the Pradhan Mantri Mudra Yojana (PMMY) and PMSVANidhi.
As of March 31, 2025, the total loan outstand- ing of MLIs stood at ₹2,38,198 Cr., reflecting a year-on-year decline of (-9%). This figure includes the microfinance portfolios of pure MFIs, NBFCs, and BC companies, and excludes the Banks and SFBs. The loan outstanding of pure MFIs (NBFC-MFIs, Societies, Section 8 Companies, Trusts, MACS, or Cooperatives) alone registered a sharper decline of (-11%).
The Assets Under Management (AUM) of MLIs comprises Off-Balance Sheet assets such as assigned and securitized loans, along with the BC portfolio, which together amounted to ₹72,930 Cr., representing 31% of the Gross Loan Portfolio. Of this, the BC portfolio alone accounted for ₹53,287 Cr. The Net Loan Portfolio, or the Own Portfolio reflected on the books of MLIs, stood at ₹1,65,268 Cr.
Figure 3.10: Gross Loan Portfolio of MLIs (in ₹ Cr.) – Yearly Trend and Category–wise Breakup as of March 2025

A further segregation of the Gross Loan Portfolio based on the legal forms of MLIs and the size of MLIs is given below:
Note: In the decadal trend graph of GLP (2015–2025) shown above, the GLP for each year is represented by blue bars, covering all Micro Lending Institutions (MLIs). For FY 2024-25, however, the total GLP of ₹2,38,198 Cr. has been further disaggregated to provide greater clarity. The breakdown highlights pure MFIs (NBFC-MFIs, Societies, Section 8 Companies, Trusts, MACS, or Cooperatives) represented by red bars, NBFCs by green bars, and Private & Public Ltd. Companies by orange bars, offering a clearer view of the growth trajectory of pure MFIs.
.svg)
.svg)
Table 3.4: Top 10 MLIs in terms of Gross Loan Portfolio (in ₹ Cr.) as of March 2025
Table 3.4, below, presents the top 10 micro-lending institutions ranked by Gross Loan Portfolio. Among them, CreditAccess Grameen holds the largest share, accounting for 11% of the total portfolio reported by MLIs.
| Name of MLI | Gross Loan Portfolio (in ₹ Cr.) |
|---|---|
| CreditAccess Grameen Ltd. (CAGL) | 25,948 |
| L&T Finance Ltd. | 25,838 |
| Muthoot Microfin Ltd. | 12,357 |
| Satin Creditcare Network Ltd. (SCNL) | 11,316 |
| IIFL Samasta Finance Ltd. | 11,101 |
| Annapurna Finance Pvt. Ltd. | 11,034 |
| Fusion Finance Ltd. | 8,980 |
| Asirvad Microfinance Ltd. | 8,189 |
| Belstar Microfinance Ltd. | 7,969 |
| Chaitanya India Fin Credit Pvt. Ltd. | 7,574 |
The top 10 MLIs account for a loan portfolio of ₹1,30,306 Cr., representing 55% of the total reported 203 MLIs, while the remaining 193 institutions collective- ly hold the remaining 45%. SKDRDP’s Loan Portfolio (₹26,259 Cr.) may not be rel- evant to this analysis, as it is completely under the BC model.
Note: (i) The microfinance portfolio of L&T Finance, an NBFC, is also reflected under the top 10 category.
Figure 3.11: Percentage of Rural-Urban Share of MLIs Gross Loan Portfolio

Figure 3.11 shows that the rural Gross Loan Portfolio (GLP) of micro-lending institutions stood at ₹1,88,176 Cr., representing 79% of the total GLP, while the urban GLP was at ₹50,022 Cr., accounting for the remaining 21%. In FY 2024-25, the rural and urban shares were 76% and 24% respectively, indicating a sharper decline in the urban portfolio and thereby increasing the rural portfolio’s share.
3.4.2 Regional Spread of MLIs’ Loan Portfolio
In terms of outstanding loan portfolio, the Southern region accounted for the largest share at 36%, followed by the Eastern region at 26%, the Central region at 19%, the Western region at 10%, and the Northern region at 7%. The North Eastern region contributed the smallest share, at just 2%.
Figure 3.12: Region-wise MLIs Gross Loan Portfolio as of March 2025

Share in the microfinance portfolio has expanded for the Southern (+1%), Western (+1%), and North Eastern (+1%) region, whereas it had declined in the Northern (-1%), Eastern (-1%), and Central (-1%) regions compared to the previous year.
While in terms of the number of borrower accounts, the difference between South and East was only 2%, in terms of portfolio, the difference is 10%. This indicates a higher ticket size of loans in the South compared to the Eastern region. This is understandable as the Southern region developed the microfinance movement first, and the credit culture is also more prevalent in that region.
3.4.3 Segments of MLIs’ Loan Portfolio
Gross Loan Portfolio under various delivery modes, collection modes, and portfolios created under co-origination is presented in Table 3.5. Of late, the portfolio under the JLG model is declining, and the portfolio under the individual lending model is picking up, due to advancements in credit assessment, strong regulatory support, and the evolving needs of mature borrowers seeking larger loan sizes, flexibility, and enhanced customer experience.
Table 3.5: Composition of Loan Portfolio under Delivery Model, Collection Mode, and Others
| % of Gross Loan Portfolio (GLP) under various modes | ||||||||
|---|---|---|---|---|---|---|---|---|
| Delivery Modes | Collection Modes | Others | ||||||
| GLP under JLG lending model | GLP under SHG lending model | GLP under Individual lending model | GLP under Grameen model | GLP under Weekly collection | GLP under Fortnightly collection | GLP under Monthly collection | GLP created under a Co-origination arrangement | |
| 79% | 12% | 8.7% | 0.3% | 15% | 21% | 64% | 1% | |
3.4.4 Gross Loan Portfolio of MLIs Across States/UTs and Individual MLIs analysis
The table 3.6 presents the Gross Loan Portfolio (GLP) of MLIs across States and Union Territories, along with year-on-year changes. The data shows that 24 States/UTs experienced a decline in their loan portfolio as of March 2025 compared to March 2024.
The contraction in the MLIs portfolio during FY 2024-25 was primarily due to a reduction in capital inflow, limiting their lending capacity. Increased borrower repayment stress led to a rise in delinquencies. Additionally, growing borrower indebtedness from larger loan sizes and multiple loans constrained repayment ability. Regulatory restrictions and weakening of the Joint Liability Group (JLG) model further contributed to cautious lending and portfolio contraction.
Among the top five states by portfolio size, Tamil Nadu recorded the highest decline at (-14.13%), followed by Bihar (-12.95%), Uttar Pradesh (-7.10%), Karnataka (-2.89%), and West Bengal(-1.00%). In contrast, portfolio growth gained momentum in Andhra Pradesh and Telangana, aided by increased lending activity following the Supreme Court’s ruling on the microfinance ordinance applicable to the erstwhile unified Andhra Pradesh. However, this growth was also modest in terms of the quantum of loans.
Table 3.6 Gross Loan Portfolio of MLIs (in ₹Cr.) across States/UTs – March 2025 & March 2024 (in descending order of Gross Loan Portfolio)
| State/UT | March 2025 | March 2024 | Y-o-Y Growth (in %) |
|---|---|---|---|
| Karnataka | 48,862 | 50,316 | -2.89% |
| Bihar | 30,616 | 35,170 | -12.95% |
| Tamil Nadu | 27,013 | 31,456 | -14.13% |
| Uttar Pradesh | 25,512 | 27,462 | -7.10% |
| Maharashtra | 16,111 | 16,510 | -2.42% |
| Madhya Pradesh | 14,300 | 16,177 | -11.61% |
| West Bengal | 14,217 | 14,361 | -1.00% |
| Odisha | 10,731 | 14,566 | -26.32% |
| Rajasthan | 8,282 | 10,969 | -24.49% |
| Gujarat | 6,954 | 7,902 | -11.99% |
| Jharkhand | 5,604 | 6,640 | -15.61% |
| Kerala | 5,563 | 6,730 | -17.33% |
| Chhattisgarh | 4,789 | 5,794 | -17.34% |
| Haryana | 4,200 | 4,081 | 2.91% |
| Punjab | 3,417 | 3,901 | -12.40% |
| Assam | 3,113 | 2,088 | 49.07% |
| Andhra Pradesh | 2,825 | 2,132 | 32.50% |
| Telangana | 2,311 | 1,009 | 129.02% |
| Uttarakhand | 1,209 | 1,292 | -6.43% |
| Tripura | 909 | 847 | 7.40% |
| Puducherry | 453 | 650 | -30.29% |
| Delhi | 437 | 190 | 130.28% |
| Himachal Pradesh | 198 | 247 | -19.91% |
| Manipur | 113 | 95 | 18.95% |
| Goa | 108 | 137 | -21.24% |
| Arunachal Pradesh | 97 | 124 | -21.77% |
| Jammu & Kashmir | 72 | 138 | -47.83% |
| Sikkim | 60 | 50 | 18.82% |
| Meghalaya | 44 | 58 | -24.14% |
| Nagaland | 35 | 67 | -47.76% |
| Mizoram | 28 | 23 | 21.74% |
| State/UT | March 2025 | March 2024 | Y-o-Y Growth (in %) |
|---|---|---|---|
| Andaman & Nicobar Islands | 8 | 36 | -77.41% |
| Chandigarh | 6 | 14 | -59.79% |
| Dadra & Nagar Haveli and Daman & Diu | - | - | 0.00% |
| Ladakh | - | - | 0.00% |
| Lakshadweep | - | - | 0.00% |
| Total | 2,38,198 | 2,61,239 | -9% |
49 Additionally, in terms of reporting 203 MLIs, the number of MLIs that have reported a Y-o-Y degrowth in loan outstanding in terms of legal form and size-wise categories are depicted below in Table 3.7 and Table 3.8:
Table 3.7: Degrowth in MLIs Loan Outstanding according to legal form category
| Legal Form | Total No. of MLIs | No. of MLIs whose loan outstanding declined Y-o-Y | % share of MLIs |
|---|---|---|---|
| NBFC-MFIs | 90 | 51 | 57% |
| NBFCs | 25 | 7 | 28% |
| Pub. & Pvt. Ltd. Coms | 18 | 13 | 72% |
| Sec. 8 Coms | 24 | 10 | 42% |
| Others | 46 | 15 | 33% |
| Total | 203 | 96 | 47% |
According to the legal form category, it can be observed from the above Table 3.7, that the segment with the maximum share of MLIs (in % terms) registering a Y-o-Y degrowth of the loan portfolio is within Pub. And Pvt. Ltd. Coms category (72%), followed by the NBFC-MFIs (57%), and Sec. 8 Coms (42%), respectively.
Table 3.8: Degrowth in MLIs Loan Outstanding according to Size-wise category
| Size-wise | Total No. of MLIs | No. of MLIs whose portfolio declined Y-o-Y | % share of MLIs |
|---|---|---|---|
| Small MFIs (GLP ≤ ₹100 Cr.) | 117 | 46 | 39% |
| Medium MFIs (GLP between ₹100 Cr.–₹500 Cr.) | 41 | 21 | 51% |
| Large MFIs (GLP between ₹500 Cr.–₹2,000 Cr.) | 23 | 14 | 61% |
| Very Large MFIs (GLP > ₹2,000 Cr.) | 22 | 15 | 68% |
| Total | 203 | 96 | 47% |
According to size-wise category, it can be observed from Table 3.8 that the segment with maximum share of MLIs (in % terms) registering a Y-o-Y degrowth of loan portfolio is within the Very Large MFIs (GLP>₹2,000 Cr.) category with 68%, followed by Large MFIs (GLP between ₹500 Cr.-₹2,000 Cr) with 61%, and Medium MFIs (GLP between ₹100 Cr.- ₹500 Cr.) with 51% respectively.
3.4.5 Off-Balance Sheet Portfolio of MLIs
MLIs have utilized securitization and direct assignment to raise capital for business expansion. Additionally, some MFIs have operated as BC agents, enabling them to expand without deploying their own capital. The securitization/BC model creates a mutually beneficial arrangement: it allows banks and financial institutions to strengthen their priority sector portfolios, while providing micro-lenders with the means to address capital constraints, generate steady income through margins, and improve compliance with Capital to Risk-Weighted Adequacy Ratio (CRAR) requirements. Although these portfolios are managed by MLIs, they are classified as Off-Balance Sheet assets.
As of March 31, 2025, MLIs in India reported a total Managed Portfolio, classified as off- balance sheet assets, of nearly ₹72,930 Cr., compared to ₹79,410 Cr. at the end of the previous FY 2024-25. This reflects an overall decline of (-8%) in the Managed Portfolio of the Micro-Lending Institutions during FY 2024-25. The total BC portfolio accounted for 22% of the overall Gross Loan Portfolio of micro-lending institutions. The category-wise distribution of the Managed Portfolio across different MLIs is illustrated in Figure 3.13.
Figure 3.13: Managed/Securitized Loan Portfolio of MLIs (in ₹ Cr.) –Yearly Trend and Category–wise Breakup as of March 2025

A further segregation of the Managed Loan Portfolio based on the legal forms of MLIs and the size of MLIs is given below:


Note: In the decadal trend graph of the Managed Portfolio (2015–2025) shown above, the Managed Portfolio for each year is represented by blue bars, covering all Micro Lending Institutions (MLIs). For FY 2024-25, however, the total Managed Portfolio of ₹72,930 Cr. has been further disaggregated to provide clearer insights. The breakdown highlights pure MFIs (NBFC-MFIs, Societies, Section 8 Companies, Trusts, MACS, or Cooperatives) shown in red, NBFCs in green, and Private & Public Ltd. Companies in orange, offering a clearer picture of the growth pattern of pure MFIs.
3.4.6 Business Correspondent (BC) Portfolio of MLIs
Business Correspondents (BCs) appointed by Banks and Financial Institutions support lending operations by sourcing clients, managing the accounts, and servicing the collections on their behalf. Initially, only NGO- MFIs were permitted to function as BCs. The RBI later extended this facility to incorporated entities also, thereby allowing NBFC-MFIs to act as BC. Consequently, an increasing number of MFIs—particularly smaller ones facing challenges in raising capital—adopted the BC model to expand their business and generate income. As of March 31, 2025, 90 MLIs were functioning as BC agents, with the total loan portfolio under the BC model standing at ₹53,287 Cr., registering a (-2%) contraction in FY 2024-25.
The distribution of the BC portfolio among different categories of MLIs is displayed in Figure 3.14:
Figure 3.14: BC Loan Portfolio of MLIs (in ₹ Cr.) and Category–wise Breakup as of March 2025

Further segregation of the Business Correspondent Loan Portfolio based on the legal forms of MLIs and the size of MLIs is given below:


Note: In the decadal trend graph of the BC Portfolio (2015–2025) shown above, the BC Loan Portfolio for each year is represented by blue bars, covering all Micro Lending Institutions (MLIs). For FY 2024-25, the total BC Portfolio of ₹53,287 Cr. has been further disaggregated to provide deeper insights. The breakdown shows pure MFIs (NBFC- MFIs, Societies, Section 8 Companies, Trusts, MACS, or Cooperatives) in red, NBFCs in green, and Private & Public Ltd. Companies in orange, offering a clearer view of the growth trend of pure MFIs.
3.4.7 MLIs Loan Outstanding per Borrower
The loan outstanding per borrower stood at ₹38,005 as of March 2025, reflecting a 1% increase over the previous year. Regionally, the average loan size was highest in the Southern region at ₹45,354, followed by the Western region at ₹38,123.
Figure 3.15: Loan Outstanding per Borrower of MLIs yearly trend and across regions for the FY 2024-25


3.4.8 Trends in clients and loan outstanding of MLIs
The growth in client base and loan outstanding within the microfinance sector has been fluctuating over the years. In the financial year 2024-25, the client base of Micro Lending Institutions (MLIs) contracted by (-10%), with loan outstanding decreasing by (-9%), as depicted in Figure 3.16. This decline in the portfolio and client base was chiefly driven by liquidity constraints, escalating credit risk, and regulatory challenges. Limited access to fresh liquidity curtailed their capacity to issue new loans and expand portfolios. Concurrently, the sector faced significant repayment stress, reflecting borrower difficulties and rising delinquencies. Overleveraging, often due to multiple loans and increasing ticket sizes, further impaired borrowers’ repayment abilities, contributing to higher default rates. Collectively, these factors led to a contraction in the MLIs’ loan portfolio and a drop in active clients during the fiscal year, signalling a cautious recalibration amid sustained sectoral stress.
Figure 3.16: Growth in MLIs clients and loan outstanding over the Years

District-wise Loan Outstanding 5
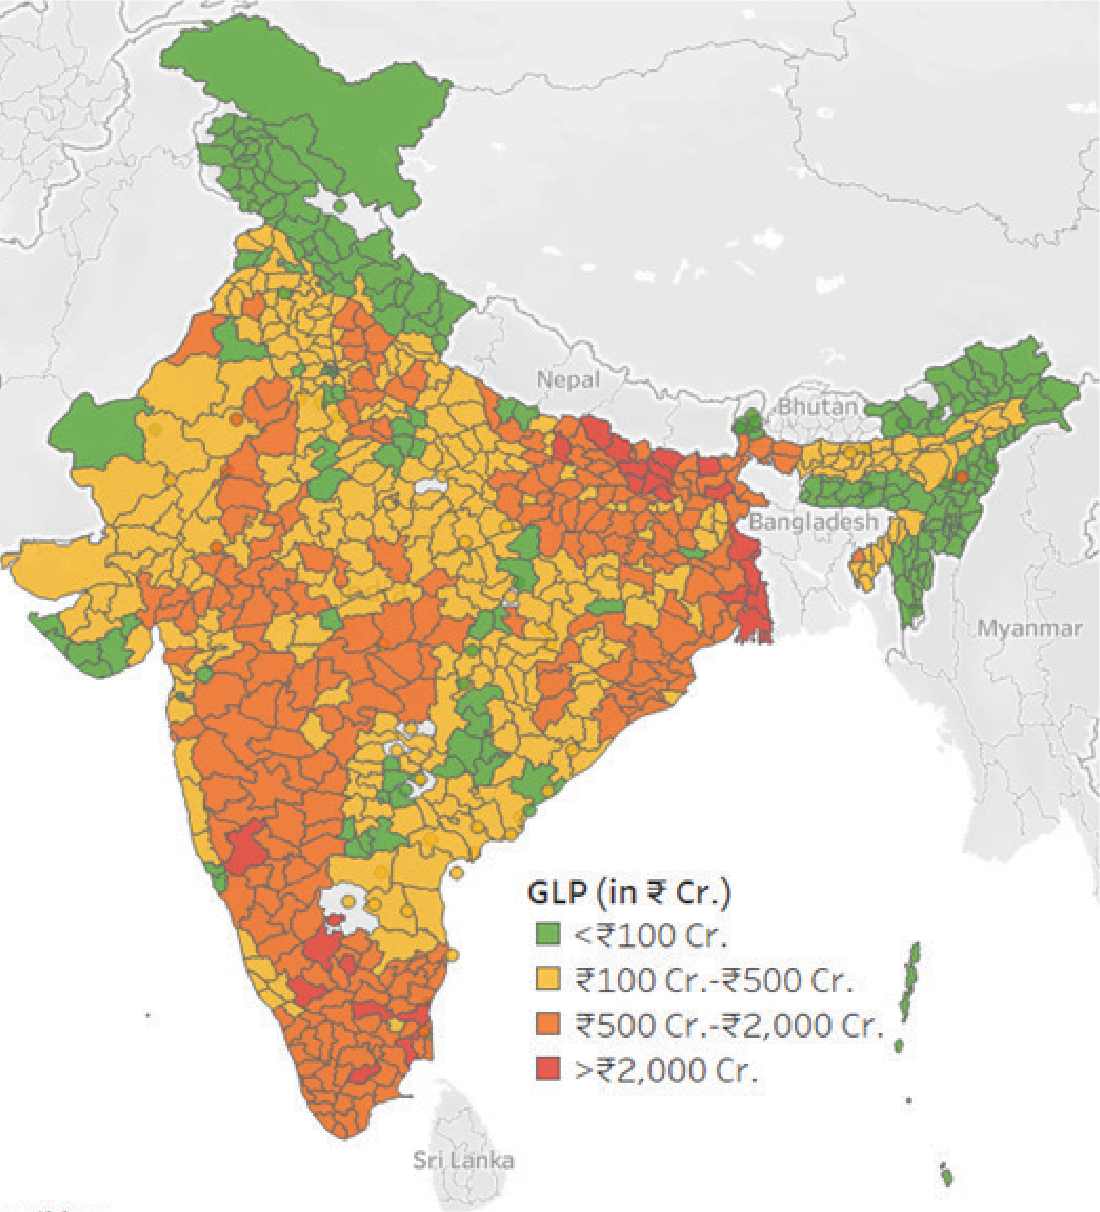
Source: Equifax India
| Portfolio size category | No. of Districts |
|---|---|
| < ₹100 Cr. | 213 |
| ₹100 Cr.–₹500 Cr. | 308 |
| ₹500 Cr.–₹2,000 Cr. | 229 |
| > ₹2,000 Cr. | 24 |
According to data from Equifax India, another major credit bureau, micro-lenders operate across 774 districts in 36 States and Union Territories. Of these, 24 districts reported an outstanding portfolio exceeding ₹2,000 Cr. This group includes 10 districts in Bihar, 5 in West Bengal, 4 each in Tamil Nadu and Karnataka, and 1 in Uttar Pradesh. A further breakdown reveals that 18 districts had portfolios above ₹2,000 Cr., 5 districts exceeded ₹3,000 Cr., and only 1 district (Murshidabad of West Bengal) recorded a portfolio above ₹4,000 Cr.
The number of districts with GLP above ₹2,000 Cr. declined from 35 in FY 2023-24 to 24 in FY 2024-25. Portfolios between ₹500 Cr. and ₹2,000 Cr. were reported in 229 districts, primarily from states such as Bihar, Tamil Nadu, Uttar Pradesh, West Bengal, Karnataka, Madhya Pradesh, Odisha, Jharkhand, Rajasthan, and Maharashtra. Additionally, 308 districts recorded GLPs in the range of ₹100 Cr.–₹500 Cr., while another 213 districts had GLPs below ₹100 Cr.
3.4.9 Loan Portfolio of Banks and SFBs
Small Finance Banks (SFBs) were established in 2015-16 by the Reserve Bank of India (RBI) as part of a strategic initiative to extend complete banking services to underserved and financially excluded segments of the population. Many of these SFBs were former MFIs, and a significant portion of their loan portfolio continues to be dominated by microfinance lending. Also, some of the Banks, especially the private sector banks, are major players within the microfinance industry. They have played an increasingly prominent role in expanding the microfinance portfolio across India by consistently increasing credit flows to MFIs and providing essential liquidity through strategic partnerships and funding arrangements.
As of 31st March 2025, through self-reported data of collectively 5 Banks and 9 SFBs, which are operating through 9,226 branches, serving nearly 250 lakh clients, hold a combined microfinance loan portfolio of ₹84,856 Cr. The 203 Micro Lending Institutions (MLIs) (collected through self-reported data) had a microfinance portfolio of ₹2,38,198 Cr. Together, these specialized institutions (203 MLIs, 5 Banks and 9 SFBs) held a combined microfinance portfolio of ₹3,23,054 Cr. However, there is a difference of about ₹58,171 Cr. compared to the combined microfinance portfolio reported in Chapter 2 (₹3,81,225 Cr.), which includes all the micro -lenders data and is sourced from the credit bureau, and the combined microfinance portfolio reported here in Chapter 3, as the self-reported data has not been received from all the Banks, SFBs, and MLIs having operations in the microfinance universe.