
Chapter 3Geographic and Institutional Expansion of Microfinance in India
The microfinance sector underwent multifaceted challenges in the last financial year, such as rising delinquencies, rising credit costs, subdued loan growth, and regulations on borrower exposure limiting the capacity to onboard new clients, resulting in lower disbursement, etc., which significantly impacted the growth, profitability, and operational stability of the Micro Lending Institutions (MLIs).

Geographic and Institutional Expansion of Microfinance in India
The microfinance sector underwent multifaceted challenges in the last financial year, such as rising delinquencies, rising credit costs, subdued loan growth, and regulations on borrower exposure limiting the capacity to onboard new clients, resulting in lower disbursement, etc., which significantly impacted the growth, profitability, and operational stability of the Micro Lending Institutions (MLIs).
However, with more caution in lending, based on the additional guardrails enforced by the SROs, there has been some improvement in the overall functioning of the microfinance institutions. Moreover, there was also an attempt to adopt better technological tools, including AI, for improving efficiency in the MLI’s functioning. The period also witnessed some consolidation, making the institutions strong and sustainable. But the majority of the institutions had a very tough time.
The analysis presented in this chapter is primarily based on data sourced from 203 Micro Lending Institutions (MLIs) operating across the country. This dataset includes various institutional types such as NBFC-MFIs, NBFCs, Sec.8 Coms, Societies, Trusts, MACS or Cooperatives, Pvt. & Pub. Ltd. Coms, while explicitly excluding Banks and SFBs.
3.1 Geographical Spread of Microfinance
The data collected from 203 MLIs indicate that microfinance has a presence in the majority of the districts, although in varying levels. It is hugely skewed towards the top 200 districts. The data on the portfolio1 from 203 MLIs, show that they collectively accounted for over 98% of the total MLIs portfolio, and covered across 28 states, 5 Union Territories, and 6852 districts in India. Notably, this dataset diverges slightly from the figures presented in Chapter 2, which rely on information sourced from Credit Information Company (CIC) and indicate micro-lenders activities in 36 States/ UTs and over 750 districts. The observed variation is likely attributable to the inclusion of certain Business Correspondent (BC) partners acting on behalf of Banks and Financial Institutions, who may have been counted as extending operations in areas reported under the wider CIC-sourced dataset. Also, some of the districts where the operations existed earlier at some levels may not be active now. This methodological difference in reporting explains the discrepancies between the two geographic coverage assessments while affirming the extensive national footprint of MLIs.
1 Portfolio, GLP, and Loan Outstanding have been used interchangeably throughout this report.
2 Some of these districts may not have an active presence of MLIs at present, as they may have exited. But they have been able to reach these districts at one time or another.
Table 3.1 provides a detailed breakdown of the number of MLIs operating across individual and multiple States or Union Territories, along with a comparative overview of the previous year’s distribution. This tabular representation enables a comprehensive understanding of operational expansion or contraction within the industry. Further, Annexure 1 presents a State and UT-wise mapping of various MLIs, Banks, and Small Finance Banks, illustrating their geographical presence across India while highlighting institutional outreach and market coverage.
An in-depth analysis reveals that during FY 2024-25, 31 MLIs operated in more than ten States or Union Territories, with 18 of these extending their operations across more than fifteen States/UTs. In contrast, 78 MLIs conducted their operations within a single State or UT, a slight decrease from 89 in the last year. Additionally, 94 MLIs functioned across 2 to 10 States/UTs. Detailed information on the geographical distribution of MLI operations across States and Union Territories is provided in Table 3.1.
Table 3.1: No. of Indian States/UTs covered by MLIs
| No. of States/UTs operated | No. of MLIs | |
|---|---|---|
| FY 2024-25 | FY 2023-24 | |
| 1 | 78 | 89 |
| 2 to 5 | 71 | 75 |
| 6 to 10 | 23 | 28 |
| 11 to 15 | 13 | 5 |
| > 15 | 18 | 20 |
| Total | 203 | 217 |
The number of States and Union Territories where Micro Lending Institutions (MLIs) operate has remained largely stable over the past two years, with minor variations in certain categories. Notably, there was a significant increase in the number of Micro Lending Institutions (MLIs) operating in 11 to 15 states, increasing from 5 MLIs in FY 2023-24 to 13 MLIs in FY 2024-25.
The larger MLIs, predominantly NBFC-MFIs, have expanded their geographic footprint across more States and UTs. In contrast, smaller MLIs, particularly those classified as “Not for Profit,” continue to focus their operations within one or two states, maintaining a regional concentration in their lending activities.
Figure 3.1 and Figure 3.2 depicts the top 10 MLIs based on their operations across States/ Union Territories and districts, respectively. Figure 3.1 depicts that Satin led with operations in 27 States/UTs, the highest among all MLIs. Following closely were Asirvad and Satya, each operating in 26 States/UTs, while Fusion and IIFL Samasta are operating in 22 States/ UTs.
Figure 3.1: Top 10 MLIs Operating in Number of Indian States/Union Territories as of March 2025

*Note: Avanti Finance has a presence in 26 States/UTs, respectively. But it works on a hybrid model (mainly tied up with Loan Service Providers/ BCs and some physical branches), to deliver different loan products to the clients across the country.
37 Figure 3.2: Top 10 MLIs Operating in Number of Indian Districts as of March 2025

*Note: Avanti Finance has a presence in 26 States/UTs, respectively. But it works on a hybrid model (mainly tied up with Loan Service Providers/ BCs and some physical branches), to deliver different loan products to the clients across the country.
Figures 3.1 and 3.2 indicate that Satin (27 states/UTs) is leading in terms of its presence in States/UTs, while Fusion (488 districts) is leading in terms of the number of districts.
Operation of MLIs in States/UTs
Table 3.2 indicates that Bihar has the highest branch network among MLIs, with 71 institutions operating a total of 4,932 branches. This was followed closely by Uttar Pradesh, which had 4,806 branches, and Tamil Nadu with 4,296 branches, respectively.
Table 3.2: No. of MLIs operating in Indian States/UTs districts as of March 2025, with the number of branches (in alphabetical order)
| Name of the State/UT | No. of MLIs operating in the State (including those having Headquarters outside) | No. of districts of the state where MLIs operate | No. of Branches |
|---|---|---|---|
| Andaman & Nicobar Islands | 2 | 1 | 4 |
| Andhra Pradesh | 26 | 25 | 527 |
| Arunachal Pradesh | 6 | 7 | 16 |
| Assam | 27 | 33 | 585 |
| Bihar | 71 | 38 | 4,932 |
| Chandigarh | 2 | 1 | 2 |
| Chhattisgarh | 41 | 30 | 906 |
| Delhi | 12 | 9 | 23 |
| Goa | 12 | 2 | 32 |
| Gujarat | 39 | 31 | 1,346 |
| Haryana | 45 | 22 | 823 |
| Himachal Pradesh | 13 | 10 | 52 |
| Jammu & Kashmir | 5 | 4 | 13 |
| Jharkhand | 45 | 24 | 1,159 |
| Karnataka | 47 | 31 | 3,362 |
| Kerala | 41 | 14 | 910 |
| Madhya Pradesh | 66 | 54 | 2,716 |
| Maharashtra | 55 | 36 | 2,271 |
| Manipur | 10 | 13 | 50 |
| Meghalaya | 9 | 5 | 14 |
| Mizoram | 5 | 4 | 13 |
| Nagaland | 3 | 3 | 8 |
| Odisha | 48 | 30 | 2,265 |
| Puducherry | 28 | 4 | 63 |
| Punjab | 23 | 23 | 584 |
| Rajasthan | 56 | 41 | 1,966 |
| Sikkim | 6 | 4 | 18 |
| Tamil Nadu | 74 | 38 | 4,296 |
| Telangana | 26 | 33 | 515 |
| Tripura | 17 | 8 | 194 |
| Uttar Pradesh | 73 | 74 | 4,806 |
| Uttarakhand | 32 | 10 | 250 |
| West Bengal | 50 | 23 | 2,658 |
| 685 | 37,380 |
3.2 MLIs Branch Network
The branches of MLIs play a vital role in facilitating business through activities such as sourcing loan applications, conducting appraisals, monitoring loans, and managing recoveries. The performance of businesses is generally closely linked to the presence and functioning of these branches.
As of March 31, 2025, a total of 37,380 MLI branches were operational across the country, compared to 33,644 MLI branches in the previous year, reflecting a year-on-year growth of 11%. However, if NBFCs and Private & Public Limited Companies are excluded and only the pure MFI category (including NBFC- MFIs, Societies, Section 8 Companies, Trusts, MACS, or Cooperatives) is considered, the year-on-year growth of branches stood at 8%.
The branch distribution as of March 2025 shows that pure MFIs operated through 28,727 branches, NBFCs engaged in microfinance operated through 5,488 branches, and Private & Public Limited Companies working as BC agents operated through 3,165 branches.
In terms of legal structure, NBFC-MFIs accounted for the predominant share with 27,687 branches (74%). A size-based analysis further highlights that Very Large MFIs (GLP> ₹2,000 Cr.) held the largest share with 25,490 branches, representing 68% of the total branches.
Figure 3.3: MLI Branch Network – Yearly Trend and Category-wise Breakup
.svg)
A further segregation of the total branch network based on the legal forms of MLIs and the size of MLIs is given below:
.svg)
.svg)
Note: In the decadal trend graph of the branch network (2015–2025) shown above, the number of branches for each year is represented by blue bars, capturing all Micro Lending Institutions (MLIs). For FY 2024-25, however, the total branch network of 37,380 has been further segmented to provide deeper insights. Specifically, the distribution highlights pure MFIs (NBFC-MFIs, Societies, Section 8 Companies, Trusts, MACS, or Cooperatives) shown by red bars, NBFCs shown by green bars, and Private & Public Ltd. Companies working as BC agents shown by orange bars. This disaggregation enables a clearer understanding of the growth trajectory of pure MFIs within the overall branch network.
Figure 3.4: Top 10 MLIs in Terms of Branch Network as of March 2025

The top 10 MLIs account for nearly 45% of the total Branch Network of the reported 203 MLIs. CreditAccess is leading with 2,063 branches, i.e., 6% of the reported total branches. The branches of L&T Finance mentioned here are those doing microfinance.
3.3 Client Outreach of MLIs
Microfinance addresses the financial needs of low-income individuals who often face difficulties accessing funds from mainstream banks. MLIs provide credit to the poor people (whose annual household income is less than ₹3 lakhs) in a convenient, hassle-free manner, at their doorstep.
The active client base of the MLIs in FY 2024- 25 had decreased to 627 lakhs from the last year’s position of 698 lakhs, posting a Y-o-Y de- growth of (-10%). However, if the client base of NBFCs and BC Companies are excluded and only the client base of the pure MFIs category (NBFC-MFIs, Societies, Sec.8 Coms, Trust, MACS or Cooperatives), are considered, then the active client base is 487 lakhs, with a Y-o-Y de-growth of (-14%).
As depicted in Figure 3.5 below, the active borrower base has nonetheless shown remarkable long-term expansion, nearly doubling over the past decade—from 371 lakhs in March 2015 to 627 lakhs in March 2025.
The majority of microfinance clients are served by NBFC-MFIs, which account for 71% of the total. The NBFCs cater to another 16%, while Societies, Trusts, MACS or Cooperatives, and BC companies each serve 7%. Section 8 Companies represent only a marginal share of 0.4%. In terms of scale, MLIs with loan outstanding exceeding ₹2,000 Cr. collectively account for nearly 81% of the reported 203 MLIs’ client base.
3 Clients of MLIs are essentially Loan Borrowers. ‘Clients’ and ‘Borrowers’ have been used interchangeably in this report.
Figure 3.5: Outreach of MLIs to Borrowers (in lakhs): Yearly Trend and Category–wise Breakup as of March 2025
.svg)
A further segregation of the total client outreach based on the legal forms of MLIs and the size of MLIs is given below:
.svg)
.svg)
Note: In the decadal trend graph of active borrowers given above, the number of active borrowers in each year (from 2015-2025) represented by blue bars, includes active borrowers of all the Micro Lending Institutions (MLIs), however for FY 2024-25, the break-up of total number of active borrowers (i.e. 627 lakhs) is segregated as pure MFIs (NBFC-MFIs, Societies, Sec.8 Coms, Trust, MACS or Cooperatives), (represented by red bar), NBFCs (represented by green bar), and Pvt. & Pub. Ltd. Coms (represented by orange bar) to get a better understanding of the growth of the pure MFIs.
3.3.1 New Borrowers4
The business expansion of MLIs is primarily driven by the addition of new borrowers. As per reported data, 158 MLIs added nearly 129 lakhs new borrowers during FY 2024-25, compared to 188 lakhs new borrowers added by 168 MLIs in the previous year. NBFC-MFIs led this growth with 103 lakhs accounting for 80% of the total, while Very Large MFIs (with GLP exceeding ₹2,000 Cr.) contributed 95 lakhs, representing 74% of the new borrowers. At the end of FY 2024-25, the total number of active borrowers with MLIs stood at 627 lakhs, down from 698 lakhs in the previous financial year.
Figure 3.6: No. of MLIs New Borrowers (in lakhs) added and Category–wise Breakup as of March 2025
.svg)
.svg)
3.3.2 Regional Outreach of MLIs
The regional distribution of microfinance clients remains uneven across the country. In FY 2024-25, out of the total active client base of 627 lakhs, the Southern region accounted for the highest share at 30%, followed by the Eastern region at 28%, the Central region at 22%, the Western region at 10%, and the Northern region at 8%. The North Eastern region had the lowest share, contributing just 2% of the active client base.
During FY 2024-25, the Southern region’s share grew from 29% to 30%, the Western region from 9% to 10%, and the North Eastern region from 1% to 2%. In contrast, the Eastern region declined from 30% to 28%, while the Northern region fell from 9% to 8%. The Central region’s share held steady at 22%.
Figure 3.7: Regional breakup of MLIs Active Client base as of March 2025
.svg)
3.3.3 State-wise MLIs Client Outreach
Table 3.3 presents the State/UT-wise MLIs’ client base, indicating that nearly all States/ UTs witnessed a negative growth during the year, with the exception of a few regions that traditionally hold a smaller share of the microfinance portfolio. These include the Andaman & Nicobar Islands, Mizoram, Sikkim, Assam, Telangana, and Andhra Pradesh. Among the larger portfolio states, sharper declines were recorded in Rajasthan (-23%), Odisha (-20%), Jharkhand (-18%), Kerala (-17%), Tamil Nadu (-15%), West Bengal (-14%), Bihar (-12%), Madhya Pradesh (-11%), and Uttar Pradesh (-9%). In contrast, Andhra Pradesh and Telangana reported a notable expansion in client outreach, driven by the entry of multiple MLIs into these markets following a favourable court ruling.
The decline in MLIs client base in FY 2024- 25 was mainly due to increased borrower rejection rates amid rising asset quality stress and indebtedness. A significant reduction in capital inflow further constrained new loan disbursements. Additionally, guardrails issued by the SROs limited multiple lending and reduced borrower overlap across MLIs, which contributed to the contraction in the active client base.
Table 3.3: Client base (in lakhs) of MLIs across States/UTs–March 2025 & March 2024 (in descending order of client outreach)
| State/UT | March 2025 | March 2024 | Y-o-Y Growth (in %) |
|---|---|---|---|
| Karnataka | 88.90 | 90.25 | -1.50% |
| Bihar | 87.20 | 99.61 | -12.45% |
| Uttar Pradesh | 76.17 | 84.03 | -9.35% |
| Tamil Nadu | 71.34 | 83.76 | -14.83% |
| Madhya Pradesh | 42.00 | 47.36 | -11.32% |
| Maharashtra | 39.97 | 40.94 | -2.38% |
| West Bengal | 37.05 | 43.30 | -14.43% |
| Odisha | 34.96 | 43.66 | -19.93% |
| Rajasthan | 25.20 | 32.63 | -22.76% |
| Gujarat | 20.50 | 21.99 | -6.78% |
| Jharkhand | 17.00 | 20.81 | -18.31% |
| Kerala | 15.57 | 18.67 | -16.61% |
| Chhattisgarh | 13.48 | 17.01 | -20.76% |
| Haryana | 12.59 | 12.89 | -2.32% |
| Punjab | 10.39 | 12.99 | -20.02% |
| Assam | 9.02 | 7.02 | 28.48% |
| Andhra Pradesh | 8.24 | 5.67 | 45.34% |
| Telangana | 6.51 | 2.79 | 133.24% |
| Uttarakhand | 3.92 | 4.21 | -6.86% |
| Tripura | 2.69 | 2.79 | -3.73% |
| Puducherry | 1.33 | 1.84 | -27.80% |
| Himachal Pradesh | 0.50 | 0.67 | -24.75% |
| Delhi | 0.45 | 0.49 | -7.72% |
| Manipur | 0.38 | 0.41 | -6.48% |
| Goa | 0.32 | 0.35 | -8.29% |
| Arunachal Pradesh | 0.23 | 0.38 | -39.07% |
| Jammu & Kashmir | 0.22 | 0.42 | -46.72% |
| Sikkim | 0.16 | 0.14 | 14.76% |
| Meghalaya | 0.11 | 0.17 | -34.92% |
| Mizoram | 0.09 | 0.07 | 33.43% |
| Nagaland | 0.09 | 0.2 | -53.69% |
| Andaman & Nicobar Islands | 0.05 | 0.02 | 141.10% |
| Chandigarh | 0.02 | 0.05 | -57.72% |
| Dadra & Nagar Haveli and Daman & Diu | 0 | 0 | 0.00% |
| Ladakh | 0 | 0 | 0.00% |
| Lakshadweep | 0 | 0 | 0.00% |
| Total | 627 | 698 | -10% |
3.3.4 Rural–Urban Share of MLIs Borrowers
MLIs cater to both rural and urban low-income populations. Earlier, the urban borrowers constituted a larger share in India; it can be seen from the graph in Figure 3.8, giving a clear edge to the urban share in FY 2015 and 2016. But the transformation of several large NBFC-MFIs, which operated largely in urban areas, into SFBs had altered this balance. At present, the client base is predominantly rural, with the vast majority of borrowers coming from rural areas. This shift aligns with the demographic structure of India, where nearly 80% of the population still resides in rural regions. Smaller MLIs have typically been rural-centric, though a few have focused exclusively on urban markets.
Figure 3.8: Trends in Rural-Urban Share of MLI Borrowers
.svg)
3.3.5 Leading MLIs in Client Outreach
MLIs cater to both rural and urban low-income segments. The figure 3.9 highlights the MLIs with the largest client bases. The list also includes L&T Finance, predominantly an NBFC, but involved in microfinance loans also, and SKDRDP, a BC agent to many banks, owing to their significant outreach in the microfinance industry. If these two are removed, the largest client share is with Credit Access Grameen, followed by Muthoot Microfin and Satin Credit Care, respectively.
Figure 3.9: Top 10 MLIs in terms of Client Outreach (in lakhs) as of March 2025
.svg)
The top 10 MLIs collectively account for around 56% of the total client base of the reporting 203 MLIs, while the remaining 193 MLIs account for the remaining 44%. Notably, the top 5 MLIs alone contribute 34% of the overall clientele. SKDRDP’s clients (36 lakhs) may not be relevant to this analysis, as it is operating entirely through the BC model.
Note: (i) The microfinance clients of L&T Finance, an NBFC, is also reflected under the top 10 category.
Box 3.1: Sonali’s determination empowered several fellow women - A success story
Sonali, an ordinary woman with determination and compassion, is transforming the lives of several fellow women in the heart of Bhadohi village, Gopiganj, Uttar Pradesh. Armed with determination and compassion, Sonali Sarkar embarked on a mission to empower women in her community through skill development and entrepreneurship.
Her journey began with a simple yet powerful initiative: a Sewing Training Centre that offered sewing training at just ₹50 per month. What set her program apart wasn’t just its affordability; it was Sonali’s commitment to her students’ success. She provided extended training at no additional cost until each woman mastered the skills needed to earn a livelihood. Through her guidance, women learned to stitch blouses and lehengas, opening doors to financial independence they never thought possible.
But Sonali’s dreams did not stop there. Recognizing another opportunity for women’s empowerment, she approached Ambition Services Pvt. Ltd. for a loan of ₹ 45,000. With these funds, she established a beauty parlour, creating a second pathway for women to learn, earn, and grow. To date, she has successfully trained ten young women in beauty services, each graduate becoming a testament to the power of skilled training and mentorship.
Today, Sonali stands as a beacon of hope and inspiration in her village. Her success isn’t measured merely in transactional terms but in the transformative impact she has on her community. As she plans to expand her beauty parlour with additional support from Ambition Services Pvt. Ltd;, her vision continues to grow.
Sonali’s story reminds us that true empowerment creates a ripple effect. Each woman she trains becomes capable of supporting her family and inspiring others to follow her. In a village where opportunities were once limited, Sonali has created a sustainable model of women’s empowerment that continues to grow and flourish, proving that when one woman rises, she lifts her entire community with her.
Courtesy: Ambition Services Pvt. Ltd.
3.4 Loan Outstanding
3.4.1 Loan Outstanding of MLIs
The borrowers typically seek loans for diverse purposes—ranging from emergencies and consumption needs to small businesses, working capital, and housing. Mainstream lenders often hesitate to meet these demands due to the small loan sizes, lack of collateral, and procedural complexities. MLIs have filled this gap, playing a crucial role in serving the financially excluded. Recognizing their importance, the Government of India has partnered with MLIs, particularly NBFC- MFIs and NBFCs, in implementing flagship schemes such as the Pradhan Mantri Mudra Yojana (PMMY) and PMSVANidhi.
As of March 31, 2025, the total loan outstanding of MLIs stood at ₹2,38,198 Cr., reflecting a year-on-year decline of (-9%). This figure includes the microfinance portfolios of pure MFIs, NBFCs, and BC companies, and excludes the Banks and SFBs. The loan outstanding of pure MFIs (NBFC-MFIs, Societies, Section 8 Companies, Trusts, MACS, or Cooperatives) alone registered a sharper decline of (-11%).
The Assets Under Management (AUM) of MLIs comprises Off-Balance Sheet assets such as assigned and securitized loans, along with the BC portfolio, which together amounted to ₹72,930 Cr., representing 31% of the Gross Loan Portfolio. Of this, the BC portfolio alone accounted for ₹53,287 Cr. The Net Loan Portfolio, or the Own Portfolio reflected on the books of MLIs, stood at ₹1,65,268 Cr.
Figure 3.10: Gross Loan Portfolio of MLIs (in ₹ Cr.) – Yearly Trend and Category–wise Breakup as of March 2025

A further segregation of the Gross Loan Portfolio based on the legal forms of MLIs and the size of MLIs is given below:
.svg)
.svg)
Note: In the decadal trend graph of GLP (2015–2025) shown above, the GLP for each year is represented by blue bars, covering all Micro Lending Institutions (MLIs). For FY 2024-25, however, the total GLP of ₹2,38,198 Cr. has been further disaggregated to provide greater clarity. The breakdown highlights pure MFIs (NBFC-MFIs, Societies, Section 8 Companies, Trusts, MACS, or Cooperatives) represented by red bars, NBFCs by green bars, and Private & Public Ltd. Companies by orange bars, offering a clearer view of the growth trajectory of pure MFIs.
Table 3.4: Top 10 MLIs in terms of Gross Loan Portfolio (in ₹ Cr.) as of March 2025
Table 3.4, below, presents the top 10 micro-lending institutions ranked by Gross Loan Portfolio. Among them, CreditAccess Grameen holds the largest share, accounting for 11% of the total portfolio reported by MLIs.
| Name of MLI | Gross Loan Portfolio (in ₹ Cr.) |
|---|---|
| CreditAccess Grameen Ltd. (CAGL) | 25,948 |
| L&T Finance Ltd. | 25,838 |
| Muthoot Microfin Ltd. | 12,357 |
| Satin Creditcare Network Ltd. (SCNL) | 11,316 |
| IIFL Samasta Finance Ltd. | 11,101 |
| Annapurna Finance Pvt. Ltd. | 11,034 |
| Fusion Finance Ltd. | 8,980 |
| Asirvad Microfinance Ltd. | 8,189 |
| Belstar Microfinance Ltd. | 7,969 |
| Chaitanya India Fin Credit Pvt. Ltd. | 7,574 |
The top 10 MLIs account for a loan portfolio of ₹1,30,306 Cr., representing 55% of the total reported 203 MLIs, while the remaining 193 institutions collective- ly hold the remaining 45%. SKDRDP’s Loan Portfolio (₹26,259 Cr.) may not be rel- evant to this analysis, as it is completely under the BC model.
Note: (i) The microfinance portfolio of L&T Finance, an NBFC, is also reflected under the top 10 category.
Figure 3.11: Percentage of Rural-Urban Share of MLIs Gross Loan Portfolio

Figure 3.11 shows that the rural Gross Loan Portfolio (GLP) of micro-lending institutions stood at ₹1,88,176 Cr., representing 79% of the total GLP, while the urban GLP was at ₹50,022 Cr., accounting for the remaining 21%. In FY 2024-25, the rural and urban shares were 76% and 24% respectively, indicating a sharper decline in the urban portfolio and thereby increasing the rural portfolio’s share.
3.4.2 Regional Spread of MLIs’ Loan Portfolio
In terms of outstanding loan portfolio, the Southern region accounted for the largest share at 36%, followed by the Eastern region at 26%, the Central region at 19%, the Western region at 10%, and the Northern region at 7%. The North Eastern region contributed the smallest share, at just 2%.
Figure 3.12: Region-wise MLIs Gross Loan Portfolio as of March 2025

Share in the microfinance portfolio has expanded for the Southern (+1%), Western (+1%), and North Eastern (+1%) region, whereas it had declined in the Northern (-1%), Eastern (-1%), and Central (-1%) regions compared to the previous year.
While in terms of the number of borrower accounts, the difference between South and East was only 2%, in terms of portfolio, the difference is 10%. This indicates a higher ticket size of loans in the South compared to the Eastern region. This is understandable as the Southern region developed the microfinance movement first, and the credit culture is also more prevalent in that region.
3.4.3 Segments of MLIs’ Loan Portfolio
Gross Loan Portfolio under various delivery modes, collection modes, and portfolios created under co-origination is presented in Table 3.5. Of late, the portfolio under the JLG model is declining, and the portfolio under the individual lending model is picking up, due to advancements in credit assessment, strong regulatory support, and the evolving needs of mature borrowers seeking larger loan sizes, flexibility, and enhanced customer experience.
Table 3.5: Composition of Loan Portfolio under Delivery Model, Collection Mode, and Others
| % of Gross Loan Portfolio (GLP) under various modes | ||||||||
|---|---|---|---|---|---|---|---|---|
| Delivery Modes | Collection Modes | Others | ||||||
| GLP under JLG lending model | GLP under SHG lending model | GLP under Individual lending model | GLP under Grameen model | GLP under Weekly collection | GLP under Fortnightly collection | GLP under Monthly collection | GLP created under a Co-origination arrangement | |
| 79% | 12% | 8.7% | 0.3% | 15% | 21% | 64% | 1% | |
3.4.4 Gross Loan Portfolio of MLIs Across States/UTs and Individual MLIs analysis
The table 3.6 presents the Gross Loan Portfolio (GLP) of MLIs across States and Union Territories, along with year-on-year changes. The data shows that 24 States/UTs experienced a decline in their loan portfolio as of March 2025 compared to March 2024.
The contraction in the MLIs portfolio during FY 2024-25 was primarily due to a reduction in capital inflow, limiting their lending capacity. Increased borrower repayment stress led to a rise in delinquencies. Additionally, growing borrower indebtedness from larger loan sizes and multiple loans constrained repayment ability. Regulatory restrictions and weakening of the Joint Liability Group (JLG) model further contributed to cautious lending and portfolio contraction.
Among the top five states by portfolio size, Tamil Nadu recorded the highest decline at (-14.13%), followed by Bihar (-12.95%), Uttar Pradesh (-7.10%), Karnataka (-2.89%), and West Bengal(-1.00%). In contrast, portfolio growth gained momentum in Andhra Pradesh and Telangana, aided by increased lending activity following the Supreme Court’s ruling on the microfinance ordinance applicable to the erstwhile unified Andhra Pradesh. However, this growth was also modest in terms of the quantum of loans.
Table 3.6 Gross Loan Portfolio of MLIs (in ₹Cr.) across States/UTs – March 2025 & March 2024 (in descending order of Gross Loan Portfolio)
| State/UT | March 2025 | March 2024 | Y-o-Y Growth (in %) |
|---|---|---|---|
| Karnataka | 48,862 | 50,316 | -2.89% |
| Bihar | 30,616 | 35,170 | -12.95% |
| Tamil Nadu | 27,013 | 31,456 | -14.13% |
| Uttar Pradesh | 25,512 | 27,462 | -7.10% |
| Maharashtra | 16,111 | 16,510 | -2.42% |
| Madhya Pradesh | 14,300 | 16,177 | -11.61% |
| West Bengal | 14,217 | 14,361 | -1.00% |
| Odisha | 10,731 | 14,566 | -26.32% |
| Rajasthan | 8,282 | 10,969 | -24.49% |
| Gujarat | 6,954 | 7,902 | -11.99% |
| Jharkhand | 5,604 | 6,640 | -15.61% |
| Kerala | 5,563 | 6,730 | -17.33% |
| Chhattisgarh | 4,789 | 5,794 | -17.34% |
| Haryana | 4,200 | 4,081 | 2.91% |
| Punjab | 3,417 | 3,901 | -12.40% |
| Assam | 3,113 | 2,088 | 49.07% |
| Andhra Pradesh | 2,825 | 2,132 | 32.50% |
| Telangana | 2,311 | 1,009 | 129.02% |
| Uttarakhand | 1,209 | 1,292 | -6.43% |
| Tripura | 909 | 847 | 7.40% |
| Puducherry | 453 | 650 | -30.29% |
| Delhi | 437 | 190 | 130.28% |
| Himachal Pradesh | 198 | 247 | -19.91% |
| Manipur | 113 | 95 | 18.95% |
| Goa | 108 | 137 | -21.24% |
| Arunachal Pradesh | 97 | 124 | -21.77% |
| Jammu & Kashmir | 72 | 138 | -47.83% |
| Sikkim | 60 | 50 | 18.82% |
| Meghalaya | 44 | 58 | -24.14% |
| Nagaland | 35 | 67 | -47.76% |
| Mizoram | 28 | 23 | 21.74% |
| State/UT | March 2025 | March 2024 | Y-o-Y Growth (in %) |
|---|---|---|---|
| Andaman & Nicobar Islands | 8 | 36 | -77.41% |
| Chandigarh | 6 | 14 | -59.79% |
| Dadra & Nagar Haveli and Daman & Diu | - | - | 0.00% |
| Ladakh | - | - | 0.00% |
| Lakshadweep | - | - | 0.00% |
| Total | 2,38,198 | 2,61,239 | -9% |
49 Additionally, in terms of reporting 203 MLIs, the number of MLIs that have reported a Y-o-Y degrowth in loan outstanding in terms of legal form and size-wise categories are depicted below in Table 3.7 and Table 3.8:
Table 3.7: Degrowth in MLIs Loan Outstanding according to legal form category
| Legal Form | Total No. of MLIs | No. of MLIs whose loan outstanding declined Y-o-Y | % share of MLIs |
|---|---|---|---|
| NBFC-MFIs | 90 | 51 | 57% |
| NBFCs | 25 | 7 | 28% |
| Pub. & Pvt. Ltd. Coms | 18 | 13 | 72% |
| Sec. 8 Coms | 24 | 10 | 42% |
| Others | 46 | 15 | 33% |
| Total | 203 | 96 | 47% |
According to the legal form category, it can be observed from the above Table 3.7, that the segment with the maximum share of MLIs (in % terms) registering a Y-o-Y degrowth of the loan portfolio is within Pub. And Pvt. Ltd. Coms category (72%), followed by the NBFC-MFIs (57%), and Sec. 8 Coms (42%), respectively.
Table 3.8: Degrowth in MLIs Loan Outstanding according to Size-wise category
| Size-wise | Total No. of MLIs | No. of MLIs whose portfolio declined Y-o-Y | % share of MLIs |
|---|---|---|---|
| Small MFIs (GLP ≤ ₹100 Cr.) | 117 | 46 | 39% |
| Medium MFIs (GLP between ₹100 Cr.–₹500 Cr.) | 41 | 21 | 51% |
| Large MFIs (GLP between ₹500 Cr.–₹2,000 Cr.) | 23 | 14 | 61% |
| Very Large MFIs (GLP > ₹2,000 Cr.) | 22 | 15 | 68% |
| Total | 203 | 96 | 47% |
According to size-wise category, it can be observed from Table 3.8 that the segment with maximum share of MLIs (in % terms) registering a Y-o-Y degrowth of loan portfolio is within the Very Large MFIs (GLP>₹2,000 Cr.) category with 68%, followed by Large MFIs (GLP between ₹500 Cr.-₹2,000 Cr) with 61%, and Medium MFIs (GLP between ₹100 Cr.- ₹500 Cr.) with 51% respectively.
3.4.5 Off-Balance Sheet Portfolio of MLIs
MLIs have utilized securitization and direct assignment to raise capital for business expansion. Additionally, some MFIs have operated as BC agents, enabling them to expand without deploying their own capital. The securitization/BC model creates a mutually beneficial arrangement: it allows banks and financial institutions to strengthen their priority sector portfolios, while providing micro-lenders with the means to address capital constraints, generate steady income through margins, and improve compliance with Capital to Risk-Weighted Adequacy Ratio (CRAR) requirements. Although these portfolios are managed by MLIs, they are classified as Off-Balance Sheet assets.
As of March 31, 2025, MLIs in India reported a total Managed Portfolio, classified as off- balance sheet assets, of nearly ₹72,930 Cr., compared to ₹79,410 Cr. at the end of the previous FY 2024-25. This reflects an overall decline of (-8%) in the Managed Portfolio of the Micro-Lending Institutions during FY 2024-25. The total BC portfolio accounted for 22% of the overall Gross Loan Portfolio of micro-lending institutions. The category-wise distribution of the Managed Portfolio across different MLIs is illustrated in Figure 3.13.
Figure 3.13: Managed/Securitized Loan Portfolio of MLIs (in ₹ Cr.) –Yearly Trend and Category–wise Breakup as of March 2025

A further segregation of the Managed Loan Portfolio based on the legal forms of MLIs and the size of MLIs is given below:


Note: In the decadal trend graph of the Managed Portfolio (2015–2025) shown above, the Managed Portfolio for each year is represented by blue bars, covering all Micro Lending Institutions (MLIs). For FY 2024-25, however, the total Managed Portfolio of ₹72,930 Cr. has been further disaggregated to provide clearer insights. The breakdown highlights pure MFIs (NBFC-MFIs, Societies, Section 8 Companies, Trusts, MACS, or Cooperatives) shown in red, NBFCs in green, and Private & Public Ltd. Companies in orange, offering a clearer picture of the growth pattern of pure MFIs.
3.4.6 Business Correspondent (BC) Portfolio of MLIs
Business Correspondents (BCs) appointed by Banks and Financial Institutions support lending operations by sourcing clients, managing the accounts, and servicing the collections on their behalf. Initially, only NGO- MFIs were permitted to function as BCs. The RBI later extended this facility to incorporated entities also, thereby allowing NBFC-MFIs to act as BC. Consequently, an increasing number of MFIs—particularly smaller ones facing challenges in raising capital—adopted the BC model to expand their business and generate income. As of March 31, 2025, 90 MLIs were functioning as BC agents, with the total loan portfolio under the BC model standing at ₹53,287 Cr., registering a (-2%) contraction in FY 2024-25.
The distribution of the BC portfolio among different categories of MLIs is displayed in Figure 3.14:
Figure 3.14: BC Loan Portfolio of MLIs (in ₹ Cr.) and Category–wise Breakup as of March 2025

Further segregation of the Business Correspondent Loan Portfolio based on the legal forms of MLIs and the size of MLIs is given below:


Note: In the decadal trend graph of the BC Portfolio (2015–2025) shown above, the BC Loan Portfolio for each year is represented by blue bars, covering all Micro Lending Institutions (MLIs). For FY 2024-25, the total BC Portfolio of ₹53,287 Cr. has been further disaggregated to provide deeper insights. The breakdown shows pure MFIs (NBFC- MFIs, Societies, Section 8 Companies, Trusts, MACS, or Cooperatives) in red, NBFCs in green, and Private & Public Ltd. Companies in orange, offering a clearer view of the growth trend of pure MFIs.
3.4.7 MLIs Loan Outstanding per Borrower
The loan outstanding per borrower stood at ₹38,005 as of March 2025, reflecting a 1% increase over the previous year. Regionally, the average loan size was highest in the Southern region at ₹45,354, followed by the Western region at ₹38,123.
Figure 3.15: Loan Outstanding per Borrower of MLIs yearly trend and across regions for the FY 2024-25


3.4.8 Trends in clients and loan outstanding of MLIs
The growth in client base and loan outstanding within the microfinance sector has been fluctuating over the years. In the financial year 2024-25, the client base of Micro Lending Institutions (MLIs) contracted by (-10%), with loan outstanding decreasing by (-9%), as depicted in Figure 3.16. This decline in the portfolio and client base was chiefly driven by liquidity constraints, escalating credit risk, and regulatory challenges. Limited access to fresh liquidity curtailed their capacity to issue new loans and expand portfolios. Concurrently, the sector faced significant repayment stress, reflecting borrower difficulties and rising delinquencies. Overleveraging, often due to multiple loans and increasing ticket sizes, further impaired borrowers’ repayment abilities, contributing to higher default rates. Collectively, these factors led to a contraction in the MLIs’ loan portfolio and a drop in active clients during the fiscal year, signalling a cautious recalibration amid sustained sectoral stress.
Figure 3.16: Growth in MLIs clients and loan outstanding over the Years

District-wise Loan Outstanding 5
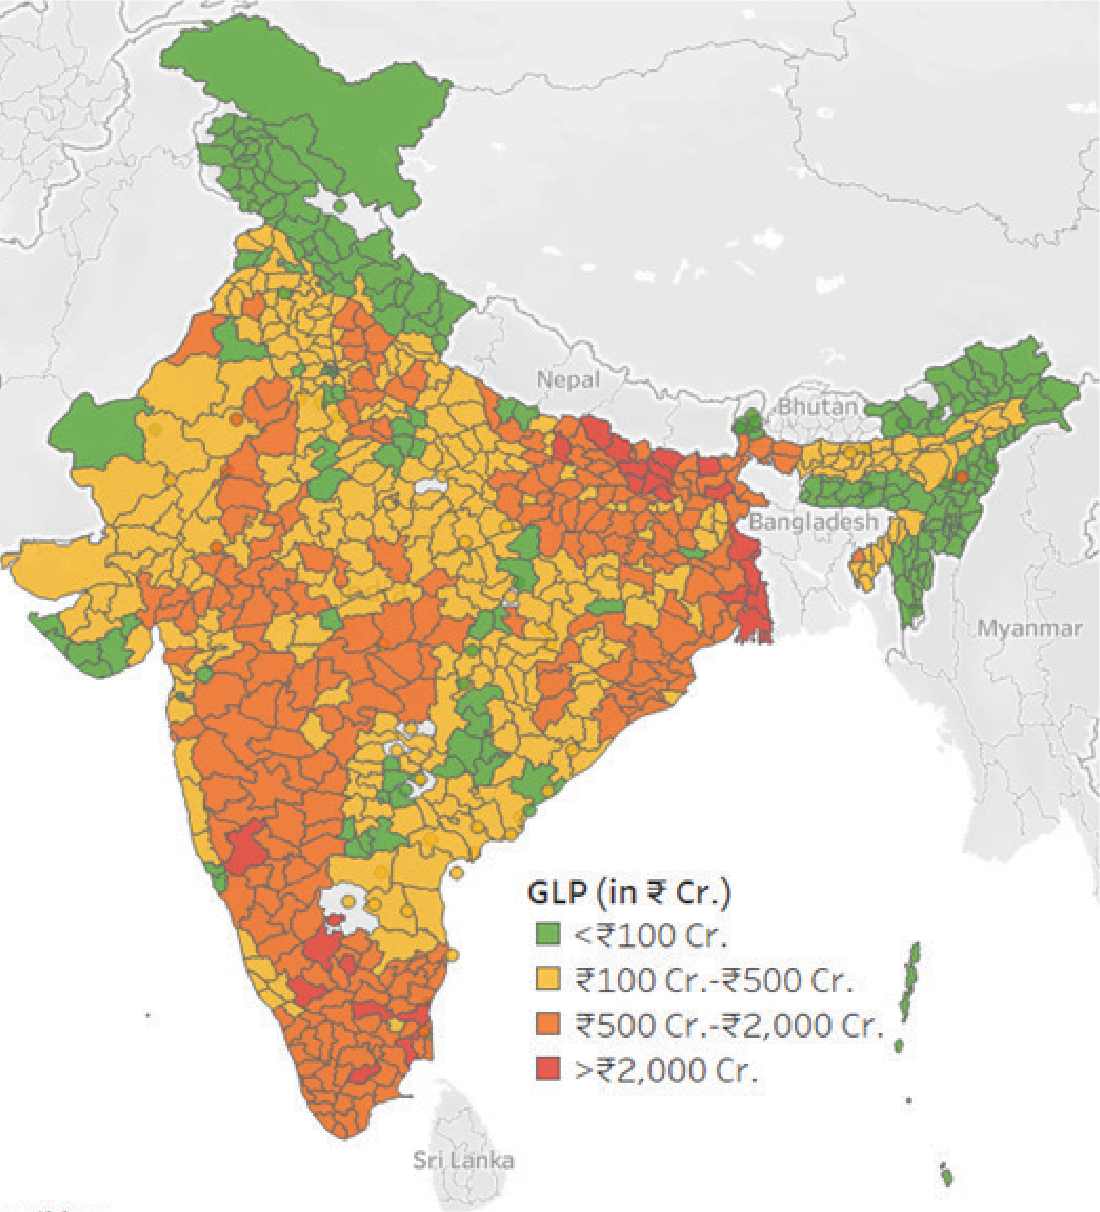
Source: Equifax India
| Portfolio size category | No. of Districts |
|---|---|
| < ₹100 Cr. | 213 |
| ₹100 Cr.–₹500 Cr. | 308 |
| ₹500 Cr.–₹2,000 Cr. | 229 |
| > ₹2,000 Cr. | 24 |
According to data from Equifax India, another major credit bureau, micro-lenders operate across 774 districts in 36 States and Union Territories. Of these, 24 districts reported an outstanding portfolio exceeding ₹2,000 Cr. This group includes 10 districts in Bihar, 5 in West Bengal, 4 each in Tamil Nadu and Karnataka, and 1 in Uttar Pradesh. A further breakdown reveals that 18 districts had portfolios above ₹2,000 Cr., 5 districts exceeded ₹3,000 Cr., and only 1 district (Murshidabad of West Bengal) recorded a portfolio above ₹4,000 Cr.
The number of districts with GLP above ₹2,000 Cr. declined from 35 in FY 2023-24 to 24 in FY 2024-25. Portfolios between ₹500 Cr. and ₹2,000 Cr. were reported in 229 districts, primarily from states such as Bihar, Tamil Nadu, Uttar Pradesh, West Bengal, Karnataka, Madhya Pradesh, Odisha, Jharkhand, Rajasthan, and Maharashtra. Additionally, 308 districts recorded GLPs in the range of ₹100 Cr.–₹500 Cr., while another 213 districts had GLPs below ₹100 Cr.
3.4.9 Loan Portfolio of Banks and SFBs
Small Finance Banks (SFBs) were established in 2015-16 by the Reserve Bank of India (RBI) as part of a strategic initiative to extend complete banking services to underserved and financially excluded segments of the population. Many of these SFBs were former MFIs, and a significant portion of their loan portfolio continues to be dominated by microfinance lending. Also, some of the Banks, especially the private sector banks, are major players within the microfinance industry. They have played an increasingly prominent role in expanding the microfinance portfolio across India by consistently increasing credit flows to MFIs and providing essential liquidity through strategic partnerships and funding arrangements.
As of 31st March 2025, through self-reported data of collectively 5 Banks and 9 SFBs, which are operating through 9,226 branches, serving nearly 250 lakh clients, hold a combined microfinance loan portfolio of ₹84,856 Cr. The 203 Micro Lending Institutions (MLIs) (collected through self-reported data) had a microfinance portfolio of ₹2,38,198 Cr. Together, these specialized institutions (203 MLIs, 5 Banks and 9 SFBs) held a combined microfinance portfolio of ₹3,23,054 Cr. However, there is a difference of about ₹58,171 Cr. compared to the combined microfinance portfolio reported in Chapter 2 (₹3,81,225 Cr.), which includes all the micro -lenders data and is sourced from the credit bureau, and the combined microfinance portfolio reported here in Chapter 3, as the self-reported data has not been received from all the Banks, SFBs, and MLIs having operations in the microfinance universe.
3.5 Loan Disbursement of MLIs
Disbursement of loans recorded steady growth all throughout, except in some years due to external events like demonetization or the COVID-19 pandemic. During FY 2024-25, another year of low growth, an aggregate disbursement of ₹1,86,318 Cr. was achieved, accounting for a (-17%) Y-o-Y de-growth. Out of the total disbursement, ₹1,59,546 Cr. had been disbursed by 22 MLIs with a portfolio size above ₹2,000 Cr.
Figure 3.17: MLIs Loan Disbursement over the years

Loan amount disbursed by the top 10 MLIs during FY 2024-25 is given below in Figure 3.18.
Figure 3.18: Top 10 MLIs in terms of Loan Amount Disbursed (in ₹ Cr.) during FY 2024-25

Top 10 MLIs together dis- bursed ₹1,17,212 Cr., which is 63% of the total reporting MLIs, and the rest of the oth- er 193 MLIs disbursed 37% only. The loan disbursement by SKDRDP (₹22,847 Cr.) may not be relevant to this analysis, as it is entirely done on the BC platform.
Note: (i) The microfinance disbursement of L&T Finance, an NBFC, is also reflected under the top 10 category.
3.5.1 Loan Disbursement of MLIs- States/ UTs and Regional Pattern
Table 3.9 indicates the State/UT-wise disbursement of microfinance loans. It can be observed that 22 States/UTs had registered negative Y-o-Y growth in terms of loan amount disbursed. The decline in MLIs’ disbursements in FY 2024-25 was again mainly due to a lesser capital inflow, which constrained their ability to provide new loans. Rising borrower delinquencies and repayment stress further made MLIs cautious in extending credit, which led to reduced loan sanctioning and disbursement activity. These factors collectively led to a significant reduction in new loan disbursements by MLIs during the year.
The top 5 states in terms of amount disbursed during FY 2024-25 were Karnataka (₹40,073 Cr.), followed by Bihar (₹23,490 Cr.), Uttar Pradesh (₹20,496 Cr.), Tamil Nadu (₹20,007 Cr.) and Maharashtra (₹12,427 Cr.) respectively. Also, these 5 States accounted for 63% of the total amount disbursed during FY 2024-25.
Table 3.9: Loan Disbursement of MLIs (in ₹ Cr.) across States/UTs – FY 2024-25 & FY 2023-24 (in descending order of Loan Amount disbursed)
| State/UT | FY 2024-25 | FY 2023-24 | Y-o-Y Growth (in %) |
|---|---|---|---|
| Karnataka | 40,073 | 44,932 | -11% |
| Bihar | 23,490 | 31,056 | -24% |
| Uttar Pradesh | 20,496 | 25,426 | -19% |
| Tamil Nadu | 20,007 | 26,525 | -25% |
| Maharashtra | 12,427 | 13,983 | -11% |
| West Bengal | 11,343 | 12,167 | -7% |
| Madhya Pradesh | 11,116 | 13,417 | -17% |
| Odisha | 8,113 | 11,787 | -31% |
| Rajasthan | 6,151 | 8,912 | -31% |
| Gujarat | 5,119 | 6,607 | -23% |
| Jharkhand | 4,232 | 5,501 | -23% |
| Kerala | 4,218 | 5,426 | -22% |
| Chhattisgarh | 3,856 | 4,965 | -22% |
| Haryana | 3,204 | 3,303 | -3% |
| Assam | 2,750 | 1,639 | 68% |
| Punjab | 2,479 | 3,022 | -18% |
| Andhra Pradesh | 2,275 | 1,721 | 32% |
| Telangana | 2,073 | 849 | 144% |
| Uttarakhand | 978 | 1,083 | -10% |
| Tripura | 605 | 584 | 4% |
| Puducherry | 356 | 478 | -26% |
| Delhi | 337 | 129 | 162% |
| Himachal Pradesh | 146 | 188 | -22% |
| Arunachal Pradesh | 85 | 75 | 14% |
| Goa | 76 | 105 | -27% |
| Manipur | 73 | 43 | 69% |
| Sikkim | 55 | 37 | 50% |
| Jammu & Kashmir | 54 | 66 | -18% |
| Meghalaya | 50 | 22 | 127% |
| Nagaland | 37 | 6 | 511% |
Karnataka is leading with the disburse- ment of ₹40,073 Cr. during FY 2024-25, including the BC portfolio of SKDRDP. Bihar is second with ₹23,490 Cr., followed by Uttar Pradesh and Tamil Nadu with ₹20,496 Cr. and ₹20,007 Cr. respec- tively.
| State/UT | FY 2024-25 | FY 2023-24 | Y-o-Y Growth (in %) |
|---|---|---|---|
| Mizoram | 24 | 27 | -9% |
| Andaman & Nicobar Islands | 15 | 9 | 61% |
| Chandigarh | 4 | 4 | -1% |
| Dadra & Nagar Haveli and Daman & Diu | 0 | 0 | 0% |
| Ladakh | 0 | 0 | 0% |
| Lakshadweep | 0 | 0 | 0% |
| Total | 1,86,318 | 2,24,094 | -17% |
Figure 3.19 Regional distribution of MLIs Loan Disbursement

Among the regions, the Southern region dominated in terms of loan disbursement of MLIs and accounted for a 37% share. This was followed by Eastern with 25% and Central with 20%, while Western and Northern regions had shares of 9% and 7% respectively. The Northeast region had the least disbursement share at 1%. Here too, the larger ticket size is visible in the Southern region, as their share in the disbursement, as their figure far exceeds the second position, i.e., the Eastern region
3.5.2 Rural–Urban Share of MLIs No. of Loans Disbursed
Out of nearly 343 lakh loans disbursed by MLIs during FY 2024-25, around 267 lakh loans were disbursed in rural areas, which constituted 78% of the share. In the urban areas, 75 lakh loans were disbursed, constituting 22% of the total number of loans disbursed. Correspondingly, ₹1,45,328 Cr. was disbursed in rural areas and ₹40,990 Cr. in urban areas during the year.
The total disbursement during the year decreased by ₹37,776 Cr. over FY 2023-24, registering an overall (-17%) Y-o-Y de-growth. The loan amount disbursed declined by (-12%) in rural areas and (-16%) in urban areas, as can be seen from Table 3.10.
Table 3.10: Amount disbursed by MLIs during the year FY 2024-25 and FY 2023-24 (in ₹ Cr.)
| MLIs’ Loan Disbursement | Loan Amount disbursed during FY 2024-25 (in ₹ Cr.) | Loan Amount disbursed during FY 2023-24 (in ₹ Cr.) | Y-o-Y Growth (in %) |
|---|---|---|---|
| Rural | 1,45,328 | 1,65,829 | -12% |
| Urban | 40,990 | 48,616 | -16% |
| Total | 1,86,318 | 2,24,094 | -17% |
Figure 3.20: Number of MLIs Loans Disbursed (Legal Form-wise and Size-wise) disbursed during FY 2024-25


During FY 2024-25, Micro Lending Institutions (MLIs) disbursed a total of 343 lakh loans, of which NBFC-MFIs accounted for 244 lakh loans, representing 71% of the total. Other institutions contributed 31 lakh loans (9%), NBFCs disbursed 51 lakh loans (15%), while Section 8 Companies had a minimal share of 1 lakh loans, constituting 0.4%.
In terms of the size of MLIs, Very Large MFIs led with 286 lakh loans disbursed (83%), followed by Large MFIs at 36 lakh loans (10%) and Medium MFIs at 15 lakh loans (4%). Smaller MFIs accounted for only 6 lakh loans, holding a 2% share of total loans disbursed.
3.5.3 MLIs Average Ticket Size (ATS)
The average amount of loans disbursed per client is calculated by dividing the total loans disbursed over a specified period of time by the number of loans disbursed. Table 3.11 shows the Average Ticket Size (ATS) for all the reporting MLIs and ticket size under different categories. NBFCs have the highest average ticket size at ₹59,052 in the legal form category, while Very Large-size MFIs have the highest average ticket size at ₹55,823 in the size-wise category.
Table 3.11: MLIs Average Ticket Size and Category–wise Breakup during FY 2024-25
| Category | Average Ticket Size (in ₹) |
|---|---|
| All MLIs | 54,352 |
| NBFC-MFIs | 50,831 |
| NBFCs | 59,052 |
| Pvt. & Pub Ltd. Coms | 47,981 |
| Sec. 8 Coms | 36,557 |
| Others | 35,436 |
| <100 Cr. | 41,512 |
| ₹100 Cr.–₹500 Cr. | 46,836 |
| ₹500 Cr.–₹2,000 Cr. | 47,888 |
| >₹2,000 Cr. | 55,823 |
District-wise Average Ticket size (ATS)
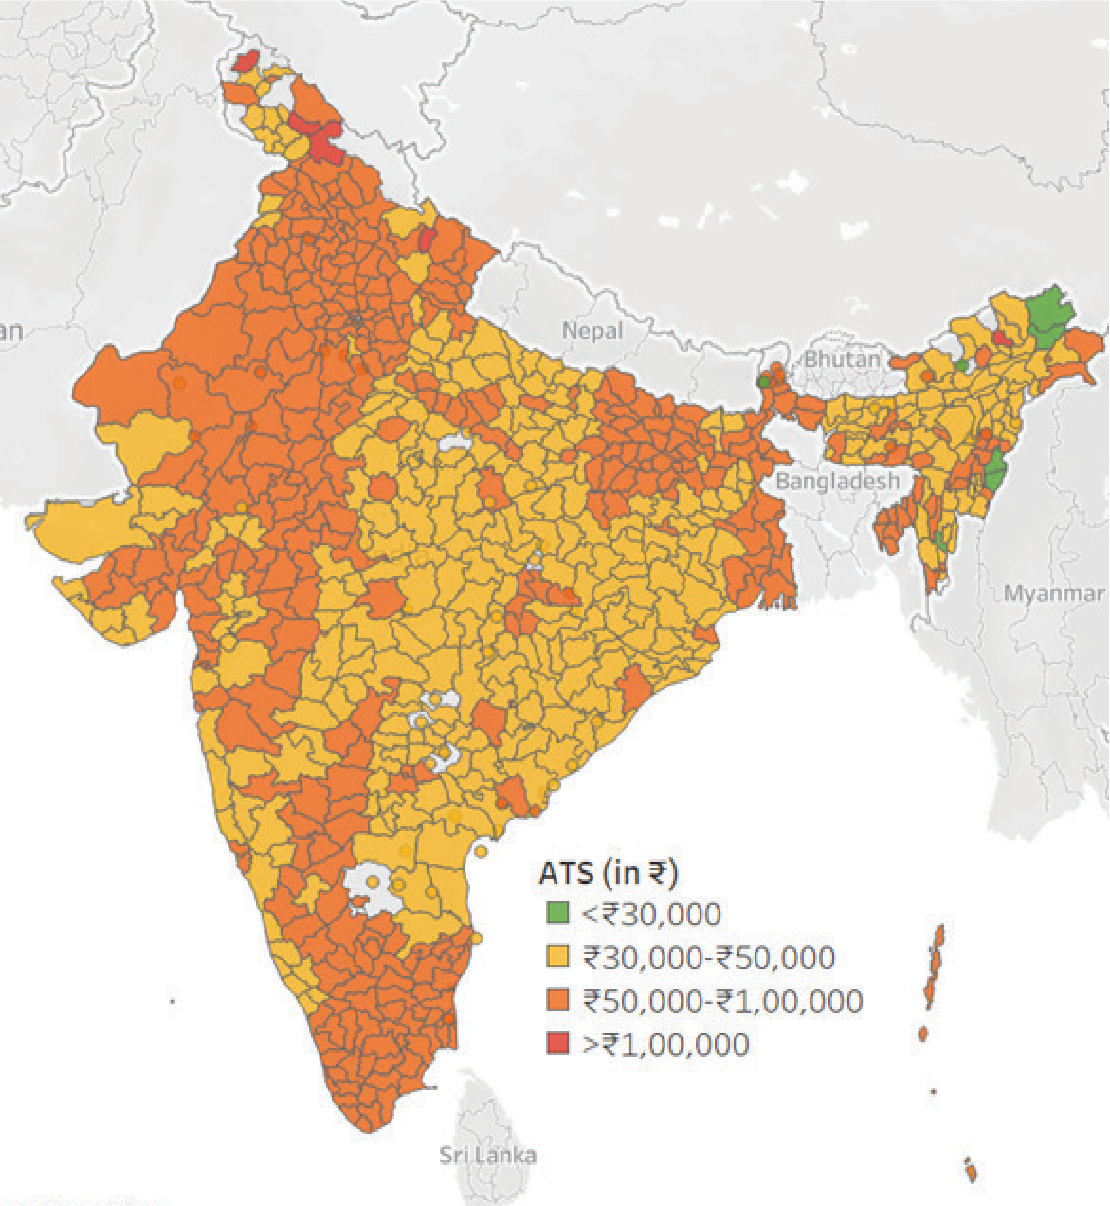
Source: Equifax India
| Average Ticket Size category | No. of Districts |
|---|---|
| <₹30,000 | 8 |
| ₹30,000–₹50,000 | 359 |
| ₹50,000–₹1,00,000 | 391 |
| >₹1,00,000 | 5 |
The Average Ticket Size (ATS) for the microfinance industry during FY 2024-25 stood at ₹51,841. During FY 2024-25, 359 districts recorded ATS between ₹30,000 and ₹50,000, compared to 585 districts in FY 2023-24. Additionally, 391 districts, primarily located in Bihar, Uttar Pradesh, Tamil Nadu, West Bengal, Madhya Pradesh, Maharashtra, and Rajasthan, reported ATS ranging from ₹50,000 to ₹1,00,000. The higher ATS in these districts likely reflects a stronger presence of Banks, Small Finance Banks (SFBs), or their Business Correspondent (BC) agents, who typically disburse larger loan amounts. Furthermore, five districts—mostly in Jammu & Kashmir, Himachal Pradesh, Uttarakhand, and Arunachal Pradesh—had ATS exceeding ₹1,00,000.
3.6 Purpose of Loan
In the new regulatory framework, RBI has not stipulated any specific percentage for income- generating and non-income-generating lending. However, the MFIs keep up the trend they had been following earlier.
The self-reported data indicate that borrowers utilize the loans for a variety of purposes, with the majority directed toward income- generating activities such as agriculture, animal husbandry, trading, and agro- enterprises. Loans are also used to a lesser extent for non-income purposes, including consumption, housing, education, water and sanitation, and health.
The detailed breakdown of loan usage across income-generating and non-income categories is illustrated in Figure 3.21. Agriculture constitutes the largest share at 35%, followed by animal husbandry, trading, and agro-enterprises. In the non- income segment, the primary loan uses are consumption, housing, education, water and sanitation, and health-related expenses.
The RBI’s recent guidelines on the reduction of qualifying asset criteria for NBFC-MFIs from 75% to 60% open up significant opportunities for the NBFC-MFIs, especially to diversify their portfolios and strengthen financial resilience. A more diversified portfolio will allow the NBFC-MFIs to better manage sector-specific shocks, such as natural disasters or socio- political disruptions that disproportionately affect low-income microfinance borrowers. By shifting a portion of lending toward less volatile segments, the NBFC-MFIs can minimize credit losses and sustain earnings across cycles. However, most of the MFIs are following a cautious approach to this new facility.
Figure 3.21: Share of MLIs Income Generation Loans and Non-income Generation Loans

3.6.1 Income Generation Loans
Figure 3.22: Share of MLIs Income Generation Loans under Different Sub-sectors as of March 2025

Figure 3.22 presents an analysis of the loan portfolio held by reporting MLIs across vari- ous sub-sectors of income-generating loans. The data indicates that agriculture loans dom- inate this category, accounting for 35%, fol- lowed by animal husbandry and trading loans, each comprising 20% of the income genera- tion loan portfolio.
3.6.2 Non-Income Generation Loans
Figure 3.23: Share of MLIs Non-Income Genera- tion Loans under Different Sub-sectors as of March 2025

Figure 3.23 highlights that among non-income generation loans, housing loans constitute the largest share at 40%. It is important to note that even within non-income generating loans, 60% are allocated to purposes such as education, consumption, health and medical needs, water and sanitation, and clean energy. These expenditures represent life-enhancing investments that generally contribute to over- all family well-being and, over the long term, strengthen the income-earning capacity of households.
3.7 Conclusion
To ensure sustainable growth in FY 2025- 26, the MLIs must adopt a multi-faceted ap- proach. This includes focusing on enhanced risk management, leveraging technology, and diversifying their product offerings. The way forward for the MLIs in FY 2025-26, some of which are mentioned below, will hinge on re- calibrating strategies to ensure sustainability, financial inclusion, and regulatory alignment amid heightened sector stress and evolving market conditions.
1. Strengthened Underwriting and Risk Management
The primary way forward for MLIs is to strengthen their underwriting processes. The industry has seen asset quality stress due to borrower over-leverage and socio-politi- cal disruptions. Therefore, institutions must implement more robust credit assessment frameworks, including real-time credit bureau reporting and accurate household income verification. Also, the MLIs need to have an individual-centric appraisal mechanism even if the borrowers are part of the JLGs.This will help them avoid lending to indebted borrow- ers and manage their Portfolio At Risk (PAR) more effectively.
2. Digital Transformation and Operational Efficiency
The MLIs must accelerate their digital trans- formation to reduce operational costs and improve outreach. This involves adopting digi- tal-first lending models, using fintech partner- ships for credit assessment, and leveraging data analytics to identify and mitigate risks. Investing in technology will also help in diver- sifying into new geographies and reducing dependence on traditional, high-cost branch networks. Automation of processes like loan origination and collections will also address the high field staff attrition rates that disrupt customer relationships and repayment disci- pline. Also the use of AI for better underwrit- ing should also be explored.
3. Diversified Product Offerings and Fund- ing Sources
To mitigate risks associated with a mono-line business, the MLIs should diversify their prod- uct portfolios beyond traditional joint liability group (JLG) loans. This includes offering a wid- er range of products like housing loans, loans against property (LAP), and loans to micro, small, and medium enterprises (MSMEs). The Reserve Bank of India (RBI) has already re- laxed norms, allowing the NBFC-MFIs to hold a larger percentage of non-qualifying assets, which provides an opportunity for strategic diversification. On the funding side, they can explore alternative sources like securitization and co-lending with banks to lower their cost of funds.
4. Adherence to Regulatory and Ethical Practices
The RBI’s new unified regulatory framework for microfinance loans, which includes a sim- plified definition of microfinance loans and the removal of certain quantitative restrictions, is a significant change. NBFC-MFIs must strictly adhere to these regulations, particularly those related to fair pricing and transparent Key Fact Statements (KFS). This focus on ethical practices and borrower protection is crucial for rebuilding investor and public confidence, especially in the wake of concerns over coer- cive recovery tactics. By prioritizing custom- er-centric approaches and financial literacy, the industry can foster a more sustainable and resilient microfinance ecosystem.
In summary, the industry’s progress in FY 2025-26 depends on a mix of regulatory align- ment, digital innovation, risk-sensitive lending, deeper ecosystem integration, and customer- centric approaches to address emerging chal- lenges and sustain inclusive growth. Moreover, the discipline in lending by adopting responsi- ble lending practices is a key to the success of microfinance in the country.