
Chapter 3 - Section 3.5Loan Disbursement of MLIs
Disbursement of loans recorded steady growth all throughout, except in some years due to external events like demonetization or the COVID-19 pandemic. During FY 2024-25, another year of low growth, an aggregate disbursement of `1,86,318 Cr. was achieved, accounting for a (-17%) Y-o-Y de-growth. Out of the total disbursement, `1,59,546 Cr. had been disbursed by 22 MLIs with a portfolio size above `2,000 Cr.

3.5 Loan Disbursement of MLIs
Disbursement of loans recorded steady growth all throughout, except in some years due to external events like demonetization or the COVID-19 pandemic. During FY 2024-25, another year of low growth, an aggregate disbursement of ₹1,86,318 Cr. was achieved, accounting for a (-17%) Y-o-Y de-growth. Out of the total disbursement, ₹1,59,546 Cr. had been disbursed by 22 MLIs with a portfolio size above ₹2,000 Cr.
Figure 3.17: MLIs Loan Disbursement over the years

Loan amount disbursed by the top 10 MLIs during FY 2024-25 is given below in Figure 3.18.
Figure 3.18: Top 10 MLIs in terms of Loan Amount Disbursed (in ₹ Cr.) during FY 2024-25

Top 10 MLIs together dis- bursed ₹1,17,212 Cr., which is 63% of the total reporting MLIs, and the rest of the oth- er 193 MLIs disbursed 37% only. The loan disbursement by SKDRDP (₹22,847 Cr.) may not be relevant to this analysis, as it is entirely done on the BC platform.
Note: (i) The microfinance disbursement of L&T Finance, an NBFC, is also reflected under the top 10 category.
3.5.1 Loan Disbursement of MLIs- States/ UTs and Regional Pattern
Table 3.9 indicates the State/UT-wise disbursement of microfinance loans. It can be observed that 22 States/UTs had registered negative Y-o-Y growth in terms of loan amount disbursed. The decline in MLIs’ disbursements in FY 2024-25 was again mainly due to a lesser capital inflow, which constrained their ability to provide new loans. Rising borrower delinquencies and repayment stress further made MLIs cautious in extending credit, which led to reduced loan sanctioning and disbursement activity. These factors collectively led to a significant reduction in new loan disbursements by MLIs during the year.
The top 5 states in terms of amount disbursed during FY 2024-25 were Karnataka (₹40,073 Cr.), followed by Bihar (₹23,490 Cr.), Uttar Pradesh (₹20,496 Cr.), Tamil Nadu (₹20,007 Cr.) and Maharashtra (₹12,427 Cr.) respectively. Also, these 5 States accounted for 63% of the total amount disbursed during FY 2024-25.
Table 3.9: Loan Disbursement of MLIs (in ₹ Cr.) across States/UTs – FY 2024-25 & FY 2023-24 (in descending order of Loan Amount disbursed)
| State/UT | FY 2024-25 | FY 2023-24 | Y-o-Y Growth (in %) |
|---|---|---|---|
| Karnataka | 40,073 | 44,932 | -11% |
| Bihar | 23,490 | 31,056 | -24% |
| Uttar Pradesh | 20,496 | 25,426 | -19% |
| Tamil Nadu | 20,007 | 26,525 | -25% |
| Maharashtra | 12,427 | 13,983 | -11% |
| West Bengal | 11,343 | 12,167 | -7% |
| Madhya Pradesh | 11,116 | 13,417 | -17% |
| Odisha | 8,113 | 11,787 | -31% |
| Rajasthan | 6,151 | 8,912 | -31% |
| Gujarat | 5,119 | 6,607 | -23% |
| Jharkhand | 4,232 | 5,501 | -23% |
| Kerala | 4,218 | 5,426 | -22% |
| Chhattisgarh | 3,856 | 4,965 | -22% |
| Haryana | 3,204 | 3,303 | -3% |
| Assam | 2,750 | 1,639 | 68% |
| Punjab | 2,479 | 3,022 | -18% |
| Andhra Pradesh | 2,275 | 1,721 | 32% |
| Telangana | 2,073 | 849 | 144% |
| Uttarakhand | 978 | 1,083 | -10% |
| Tripura | 605 | 584 | 4% |
| Puducherry | 356 | 478 | -26% |
| Delhi | 337 | 129 | 162% |
| Himachal Pradesh | 146 | 188 | -22% |
| Arunachal Pradesh | 85 | 75 | 14% |
| Goa | 76 | 105 | -27% |
| Manipur | 73 | 43 | 69% |
| Sikkim | 55 | 37 | 50% |
| Jammu & Kashmir | 54 | 66 | -18% |
| Meghalaya | 50 | 22 | 127% |
| Nagaland | 37 | 6 | 511% |
Karnataka is leading with the disburse- ment of ₹40,073 Cr. during FY 2024-25, including the BC portfolio of SKDRDP. Bihar is second with ₹23,490 Cr., followed by Uttar Pradesh and Tamil Nadu with ₹20,496 Cr. and ₹20,007 Cr. respec- tively.
| State/UT | FY 2024-25 | FY 2023-24 | Y-o-Y Growth (in %) |
|---|---|---|---|
| Mizoram | 24 | 27 | -9% |
| Andaman & Nicobar Islands | 15 | 9 | 61% |
| Chandigarh | 4 | 4 | -1% |
| Dadra & Nagar Haveli and Daman & Diu | 0 | 0 | 0% |
| Ladakh | 0 | 0 | 0% |
| Lakshadweep | 0 | 0 | 0% |
| Total | 1,86,318 | 2,24,094 | -17% |
Figure 3.19 Regional distribution of MLIs Loan Disbursement

Among the regions, the Southern region dominated in terms of loan disbursement of MLIs and accounted for a 37% share. This was followed by Eastern with 25% and Central with 20%, while Western and Northern regions had shares of 9% and 7% respectively. The Northeast region had the least disbursement share at 1%. Here too, the larger ticket size is visible in the Southern region, as their share in the disbursement, as their figure far exceeds the second position, i.e., the Eastern region
3.5.2 Rural–Urban Share of MLIs No. of Loans Disbursed
Out of nearly 343 lakh loans disbursed by MLIs during FY 2024-25, around 267 lakh loans were disbursed in rural areas, which constituted 78% of the share. In the urban areas, 75 lakh loans were disbursed, constituting 22% of the total number of loans disbursed. Correspondingly, ₹1,45,328 Cr. was disbursed in rural areas and ₹40,990 Cr. in urban areas during the year.
The total disbursement during the year decreased by ₹37,776 Cr. over FY 2023-24, registering an overall (-17%) Y-o-Y de-growth. The loan amount disbursed declined by (-12%) in rural areas and (-16%) in urban areas, as can be seen from Table 3.10.
Table 3.10: Amount disbursed by MLIs during the year FY 2024-25 and FY 2023-24 (in ₹ Cr.)
| MLIs’ Loan Disbursement | Loan Amount disbursed during FY 2024-25 (in ₹ Cr.) | Loan Amount disbursed during FY 2023-24 (in ₹ Cr.) | Y-o-Y Growth (in %) |
|---|---|---|---|
| Rural | 1,45,328 | 1,65,829 | -12% |
| Urban | 40,990 | 48,616 | -16% |
| Total | 1,86,318 | 2,24,094 | -17% |
Figure 3.20: Number of MLIs Loans Disbursed (Legal Form-wise and Size-wise) disbursed during FY 2024-25


During FY 2024-25, Micro Lending Institutions (MLIs) disbursed a total of 343 lakh loans, of which NBFC-MFIs accounted for 244 lakh loans, representing 71% of the total. Other institutions contributed 31 lakh loans (9%), NBFCs disbursed 51 lakh loans (15%), while Section 8 Companies had a minimal share of 1 lakh loans, constituting 0.4%.
In terms of the size of MLIs, Very Large MFIs led with 286 lakh loans disbursed (83%), followed by Large MFIs at 36 lakh loans (10%) and Medium MFIs at 15 lakh loans (4%). Smaller MFIs accounted for only 6 lakh loans, holding a 2% share of total loans disbursed.
3.5.3 MLIs Average Ticket Size (ATS)
The average amount of loans disbursed per client is calculated by dividing the total loans disbursed over a specified period of time by the number of loans disbursed. Table 3.11 shows the Average Ticket Size (ATS) for all the reporting MLIs and ticket size under different categories. NBFCs have the highest average ticket size at ₹59,052 in the legal form category, while Very Large-size MFIs have the highest average ticket size at ₹55,823 in the size-wise category.
Table 3.11: MLIs Average Ticket Size and Category–wise Breakup during FY 2024-25
| Category | Average Ticket Size (in ₹) |
|---|---|
| All MLIs | 54,352 |
| NBFC-MFIs | 50,831 |
| NBFCs | 59,052 |
| Pvt. & Pub Ltd. Coms | 47,981 |
| Sec. 8 Coms | 36,557 |
| Others | 35,436 |
| <100 Cr. | 41,512 |
| ₹100 Cr.–₹500 Cr. | 46,836 |
| ₹500 Cr.–₹2,000 Cr. | 47,888 |
| >₹2,000 Cr. | 55,823 |
District-wise Average Ticket size (ATS)
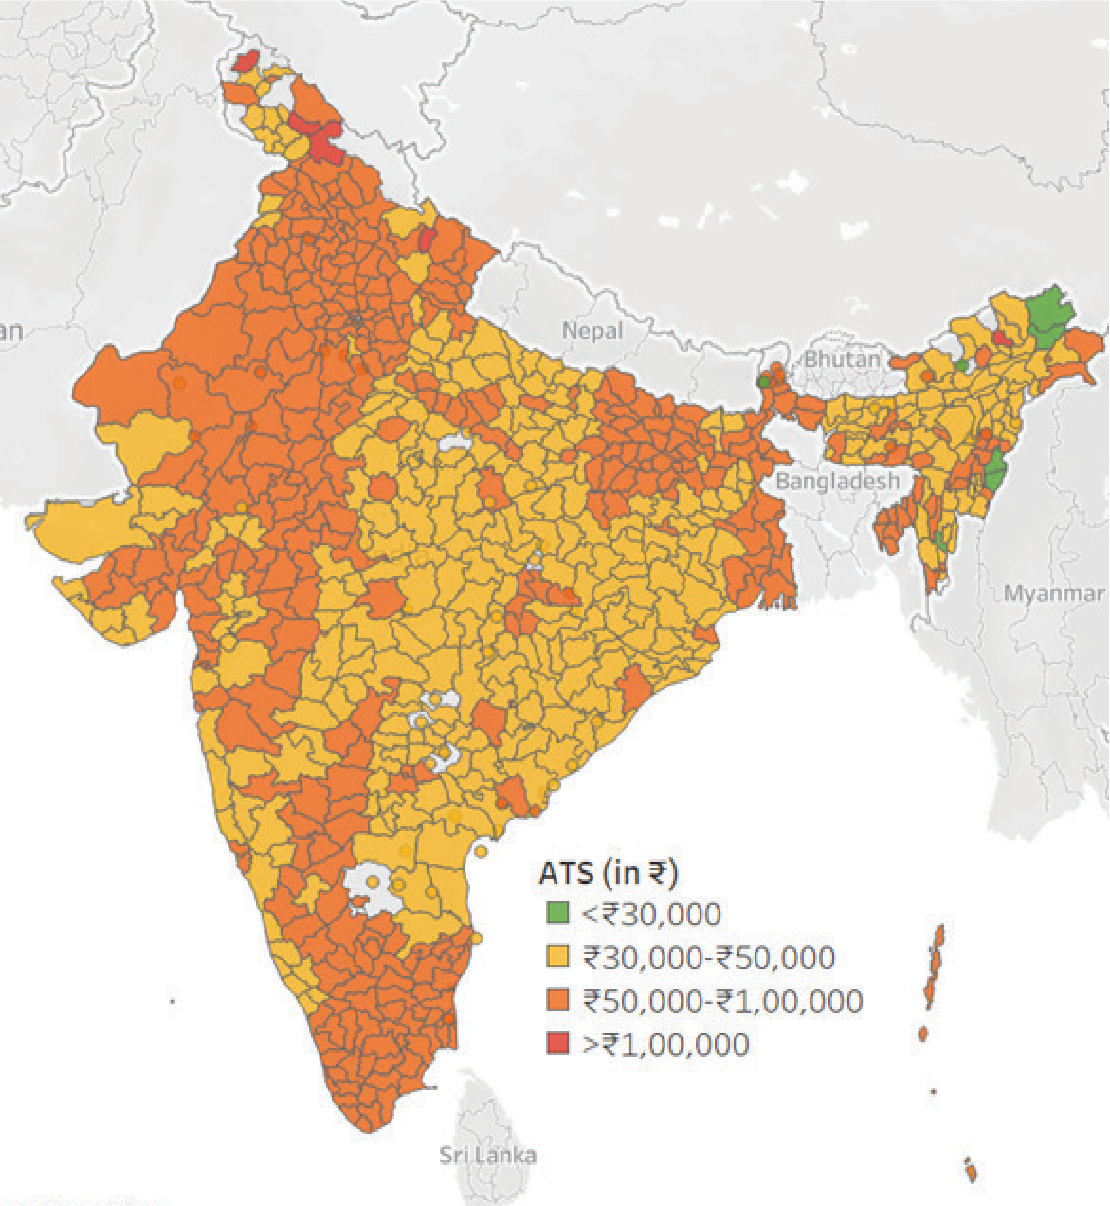
Source: Equifax India
| Average Ticket Size category | No. of Districts |
|---|---|
| <₹30,000 | 8 |
| ₹30,000–₹50,000 | 359 |
| ₹50,000–₹1,00,000 | 391 |
| >₹1,00,000 | 5 |
The Average Ticket Size (ATS) for the microfinance industry during FY 2024-25 stood at ₹51,841. During FY 2024-25, 359 districts recorded ATS between ₹30,000 and ₹50,000, compared to 585 districts in FY 2023-24. Additionally, 391 districts, primarily located in Bihar, Uttar Pradesh, Tamil Nadu, West Bengal, Madhya Pradesh, Maharashtra, and Rajasthan, reported ATS ranging from ₹50,000 to ₹1,00,000. The higher ATS in these districts likely reflects a stronger presence of Banks, Small Finance Banks (SFBs), or their Business Correspondent (BC) agents, who typically disburse larger loan amounts. Furthermore, five districts—mostly in Jammu & Kashmir, Himachal Pradesh, Uttarakhand, and Arunachal Pradesh—had ATS exceeding ₹1,00,000.