
Chapter 4 - Section 4.5Balance Sheet and Capital Structure
Since the Reserve Bank of India (RBI) introduced its revised framework in March 2022, microfinance institutions (MFIs) in India have undergone a fundamental transformation in their accounting and audit practices. Designed to harmonize regulations across all lenders engaged in microfinance, the framework moves away from a rigid, rulebased system toward more judgment-driven and principle-based standards.


Chapter 4: Section V
Balance Sheet and Capital Structure
Since the Reserve Bank of India (RBI) introduced its revised framework in March 2022, microfinance institutions (MFIs) in India have undergone a fundamental transformation in their accounting and audit practices. Designed to harmonize regulations across all lenders engaged in microfinance, the framework moves away from a rigid, rulebased system toward more judgment-driven and principle-based standards.
A key development is the adoption of Indian Accounting Standards (Ind AS)1 for asset classification and income recognition. This has replaced the earlier system, which relied primarily on days past due metrics, with a forward-looking Expected Credit Loss (ECL) model. Under this approach, auditors must critically evaluate the statistical models, assumptions, and management judgments that MLIs use to estimate potential loan losses. Ind AS has also introduced the Effective Interest Rate (EIR) method, which requires institutions to account for upfront fees and transaction costs in a more nuanced manner, demanding accurate calculations and greater transparency in disclosures.
For auditors, these shifts significantly expand the scope of review. The focus is no longer limited to quantitative accuracy in financial statements but extends to qualitative aspects of governance and operational soundness. Greater attention must now be given to board approved policies on household income assessment, transparent loan pricing, and borrower protection. By doing so, auditors ensure not just compliance with financial reporting norms but also adherence to the RBI’s broader vision of responsible lending, customer care, and sustainable financial inclusion.
4.5.1 Assets of MLIs
Total assets represent the overall economic resources controlled by a microlending institution (MLI), reflecting its financial strength, operational scale, and capacity to serve clients. For MFIs, total assets are a key indicator of size and growth, as they determine the amount of lending the institution can undertake and its ability to expand outreach effectively. A larger asset base enhances credibility with investors, lenders, and regulators, enabling access to cheaper funding and greater sustainability. Moreover, monitoring total assets helps assess efficiency, resource allocation, and long-term viability. In essence, total assets embody the foundation upon which MLIs build inclusive financial services.
Figure 4.5.1 depicts the trend of total assets over the last fourteen years. An upward trend is observed over this period, except for FY2024-25, where it sharply slopes downward. This downward slope is mainly driven by the shrinkage in the overall portfolio of MLIs.
1 NBFC-MFIs need to use Indian Accounting Standards (Ind AS) if they are listed (or in the process of listing) with a net worth less than ₹500 crore, or if they are unlisted with a net worth of ₹250 crore or more but less than ₹500 crore, as well as their holding, subsidiary, joint venture, or associate companies.
Figure 4.5.1: MLI Total Assets- Yearly Trend

Distribution of Assets
Assets are central to the functioning of microlending institutions (MLIs), shaping both income generation and financial stability. The loan portfolio, which typically constitutes the largest share of assets, is the primary revenue driver, and its quality determines the sustainability of the organisation. Cash reserves and bank deposits provide liquidity for smooth operations and timely disbursements, while investments in secure instruments add income and mitigate risk. Fixed assets such as offices, vehicles, and IT systems support outreach and service delivery. Together, these assets strike a balance between profitability and resilience, ensuring that MFIs can effectively serve low-income clients while maintaining the confidence of investors and regulators.
Figure 4.5.2: Composition of Total Assets of MLIs

4.5.2 Funds for MLI operations
4.5.2.i Net Owned Fund
Net Owned Fund (NOF) is vital for MFIs as it reflects their core capital strength and capacity to absorb risks. A higher NOF enhances credibility with regulators, investors, and lenders, enabling greater borrowing and portfolio expansion. It serves as a cushion against loan losses and operational challenges, while also supporting growth, innovation, and long-term sustainability. The Net Owned Fund for the financial year 2024-25 is ₹33,189 crores
Equity Outstanding
Equity outstanding in microlending institutions (MLIs) refers to the total value of shares held by promoters, investors, and other shareholders. It represents the ownership capital that forms the foundation of an MLI’s financial structure. Equity is crucial because it provides permanent capital that strengthens the balance sheet, absorbs risks, and supports borrowing from banks and financial markets. Higher equity outstanding signals investor confidence and enhances the institution’s credibility, while also enabling regulatory compliance and portfolio expansion. For MLIs, strong equity levels are essential to sustain growth, attract funding, and ensure longterm financial stability in serving low-income clients.
Figure 4.5.3: MLI Equity Outstanding - Yearly Trend and MLI- Category-wise Break-up of March 2025


Fresh Equity Acquired
Strong financial performance, including consistent profitability and efficient cost management, forms the foundation for attracting investors. Equally important is robust asset quality, reflected in low delinquency and portfolio-at-risk levels, which signals lower credit risk. Adequate net owned funds and transparent governance practices enhance credibility with both regulators and investors. MLIs that demonstrate clear growth potential, adoption of technology, and measurable social impact are particularly attractive to equity investors. A proven management track record further reinforces confidence, making equity mobilization more effective. During the financial year 2024-25, total equity raised by the MLIs is ₹1,855 crores, which is 28% lower than the last year (FY 2023-24). Figure 4.5.4 gives a detailed breakdown of the fresh equity raised by the lenders in terms of legal form and size.
Figure 4.5.4: Fresh Equity Raised by MLIs and MLI-Category-wise Break-up

The top 10 MLIs in terms of fresh equity raised are listed in Figure 4.5.5. The top 10 MLIs contribute to the 92% equity raised during the year.
Figure 4.5.5: Top 10 MLIs in terms of Equity Raised

4.5.2.ii Debt Funding
Debt funding forms a critical component of an MLI’s capital structure, complementing equity and retained earnings to finance loan portfolios. It typically comprises bank loans, bonds, securitised debt, and borrowings from financial institutions or NBFCs. MLIs rely on debt because it allows them to scale outreach rapidly without diluting ownership, given that equity is often limited. The cost, tenor, and structure of debt directly affect an MFI’s interest rate policy, liquidity management, and overall profitability. Prudent debt management ensures sustainable growth, enabling MFIs to extend microloans to underserved populations while maintaining financial stability and regulatory compliance.
Debt funding for MFIs declined sharply from ₹1,30,096 crore in FY2023-24 to ₹85,877 crore in FY2024- 25, reflecting a reduction of around 34%. This drop is primarily due to tighter credit from banks and financial institutions, driven by cautious lending amid a rise in perceived riskiness of the sector. Regulatory constraints and prudential norms may have limited leverage, while lenders’ concerns over asset quality and macroeconomic risks further restrained funding. A breakdown of various sources of debt funding enjoyed by MLI during FY 2024-25 is given in Figure 4.5.6
Figure 4.5.6: Sources of funding based on types of instruments

Microlending Institutions (MLIs) rely on multiple borrowing sources to finance their lending operations and portfolio expansion. Banks are a key source, offering term loans, working capital, and overdrafts at competitive rates. Financial institutions and NBFCs offer structured loans or credit lines tailored to the growth needs of MFIs. Capital markets are increasingly used, with bonds and debentures enabling access to medium- and long-term funding. Securitisation of loan portfolios allows MFIs to convert receivables into immediate liquidity. Additionally, colending arrangements with banks help share risk while mobilising funds. These diverse sources ensure MLIs maintain liquidity, support outreach, and sustain operations efficiently. Figure 4.5.7 illustrates the source of funding for MLIs in FY2024-25, categorised by institution type.
Figure 4.5.7: Sources of funding based on Institution types
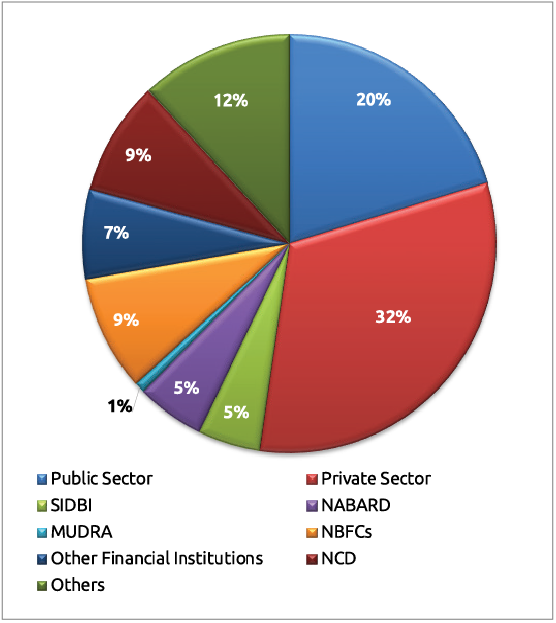
Figure 4.5.8 shows the trend of Borrowing Outstanding of MLIs over more than 10 years, along with legal-form and size-wise distribution for FY2024-25.
Figure 4.5.8: Outstanding Borrowings (₹ in Cr.)– Yearly Trend and MLI-Category-wise Break-up of 2025


Debt received by MLIs declined sharply from ₹1,05,306 crore in FY2023-24 to ₹58,046 crore in FY2024-25, representing a nearly 45% reduction. This significant fall can be attributed to multiple factors. Cautious lending by banks and financial institutions limited access to new debt. Higher borrowing costs made traditional loans less attractive, prompting MFIs to rely more heavily on alternative sources. Regulatory constraints and prudential norms further restricted leverage, while concerns over portfolio quality and potential NPAs made lenders wary. Additionally, MFIs have increasingly explored alternative financing options, such as BC and co-lending arrangements, thereby reducing their dependence on conventional debt sources. Figure 4.5.9 shows the borrowing received by MLIs based on legal form and size.
Figure 4.5.9: Fund Received during the year and MLI-Category-wise Break-up of 2025

Table 4.5.1 and Figure 4.5.10 below illustrate the debt received by MLIs from various source types.
Table 4.5.1: Source-wise and received by different entities during the year
| Public Sector Banks | Private Sector Banks | SIDBI | NABARD | MUDRA | NBFCs | Other Fin. Ints. | NCDs | Any Others | |
|---|---|---|---|---|---|---|---|---|---|
| NBFC-MFIs | 13,010 | 21,140 | 1,442 | 2,514 | 110 | 4,645 | 3,538 | 2,831 | 6,495 |
| NBFCs | 40 | 424 | - | - | - | 792 | 10 | 308 | 356 |
| Sec. 8 Coms | 53 | 23 | 1 | - | - | 10 | 3 | 1 | - |
| Others | 143 | 42 | - | - | - | 33 | 36 | - | 46 |
| Total | 13,246 | 21,629 | 1,443 | 2,514 | 110 | 5,480 | 3,587 | 3,140 | 6,897 |
Figure 4.5.10: Source-wise Share of Loans lent among Different Legal Forms of MLIs during 2024-25

Top Lenders to MLIs during 2024-25
The tables below list the major lenders (based on the information received for the top 10 lenders for each institution) that provide debt funds to MLIs.
Table 4.5.2 (a): List of banks that lent to MLIs as of March 2025 (Based on the Top 10 lenders out of the total)
| S. No. | Name of Lenders | No. of MLIs |
|---|---|---|
| 1 | Assam Gramin Vikash Bank | 1 |
| 2 | AU SFB | 5 |
| 3 | Axis Bank Ltd. | 9 |
| 4 | Bandhan Bank Ltd. | 9 |
| 5 | Bangiya Gramin Vikash Bank | 2 |
| 6 | Bank of Baroda | 18 |
| 7 | Bank of India | 21 |
| 8 | Bank of Maharashtra | 2 |
| 9 | Canara Bank | 8 |
| 10 | Capital SFB | 2 |
| 11 | Chandrapur District Central Co-Operative Bank (CDCC) | 1 |
| 12 | City Union Bank | 1 |
| 13 | CSB Bank Ltd. | 1 |
| 14 | DBS Bank Ltd. | 4 |
| 15 | Deutsche Bank | 1 |
| 16 | Dhanlaxmi Bank Ltd. | 2 |
| 17 | Doha Bank | 1 |
| 18 | Federal Bank Ltd. | 10 |
| 19 | HDFC Bank | 5 |
| 20 | HSBC Bank Ltd. | 1 |
| 21 | IBL Finance Ltd. | 6 |
| 22 | ICICI Bank Ltd. | 7 |
| 23 | IDBI Bank | 5 |
| 24 | IDFC First Bank Ltd. | 22 |
| 25 | IndusInd Bank | 41 |
| 26 | Inclusion Finance Pvt. Ltd. | 1 |
| 27 | InCred Financial Services Ltd. | 1 |
| 28 | Indian Bank | 5 |
| 29 | Indian Overseas Bank | 21 |
| 30 | IndusInd Bank Ltd. | 2 |
| 31 | Jana SFB | 3 |
| 32 | Karnataka Bank | 1 |
| 33 | Karnataka Vikas Grameen Bank | 1 |
| 34 | Karur Vysya Bank | 1 |
| 35 | Kerala Gramin Bank | 1 |
| 36 | Kotak Mahindra Bank Ltd. | 7 |
| 37 | MUDRA | 3 |
| 38 | NABARD | 1 |
| 39 | Pudhuwai Bharathiyar Grama Bank | 1 |
| 40 | Punjab & Sindh Bank | 1 |
| 41 | Punjab National Bank | 13 |
| 42 | SBM Bank | 1 |
| 43 | Shivalik SFB | 1 |
| 44 | SIDBI | 3 |
| 45 | Standard Chartered Bank Ltd. | 25 |
| 46 | State Bank of India | 26 |
| 47 | State Bank of Mauritius | 1 |
| 48 | Suryodoy SFB | 1 |
| 49 | Tamil Nadu Grameen Bank | 3 |
| 50 | Tamilnad Mercantile Bank | 3 |
| 51 | The Assam Co-operative Apex Bank Ltd. | 1 |
| 52 | UCO Bank | 6 |
| 53 | Union Bank of India | 11 |
| 54 | Unity SFB | 1 |
| 55 | Utkarsh SFB | 2 |
| 56 | Yes Bank | 6 |
Table 4.5.2 (b): List of other lenders who lent to MLIs as of March 2025 (Based on the Top 10 lenders out of the total)
| S. No. | Name of Lenders | No. of MLIs |
|---|---|---|
| 1 | Aditya Birla Finance Ltd. | 3 |
| 2 | AFI Fund - IIV Mikrofinanzfonds | 1 |
| 3 | Agent for Impact (AFI) | 1 |
| 4 | Ajanta Pharma Ltd. | 1 |
| 5 | Alwar General Finance Co. Pvt. Ltd. | 1 |
| 6 | Ambit Finvest Pvt. Ltd. | 1 |
| 7 | Ambium Finserve Pvt. Ltd. | 1 |
| 8 | Annapurna Finance Pvt. Ltd. | 2 |
| 9 | Any Other (Saving mobilization) | 1 |
| 10 | Arohan Financial Services Ltd. | 18 |
| 11 | ASA International N.V. | 3 |
| 12 | Aspire & Innovative Advertising Ltd. | 1 |
| 13 | Assam Financial Corporation | 1 |
| 14 | Avanti Finance Pvt. Ltd. | 5 |
| 15 | Bajaj Finance Ltd. | 3 |
| 16 | BC Co-Operative Partners | 1 |
| 17 | BIFCO Leasing & Finance Pvt. Ltd. | 1 |
| 18 | Blacksoil Capital Pvt. Ltd. | 3 |
| 19 | BlueOrchard Finance Ltd. (BlueOrchard Microfinance Fund) | 7 |
| 20 | Carron Capital Advisors | 1 |
| 21 | Caspian Impact Investments Pvt. Ltd. | 4 |
| 22 | Clime Finance Pvt. Ltd. | 2 |
| 23 | Clix Capital Services Pvt. Ltd. | 2 |
| 24 | Concord | 2 |
| 25 | Credit Saison | 3 |
| 26 | Developing World Markets (DWM) | 1 |
| 27 | Electronica Finance Ltd. | 3 |
| 28 | Enabling Capital Ltd. | 2 |
| 29 | Enabling Capital Trust | 2 |
| 30 | Experimac Finance Pvt. Ltd. | 1 |
| 31 | Financial Institution | 1 |
| 32 | Finhive Capital Pvt. Ltd. | 3 |
| 33 | Finstars Capital Ltd. | 10 |
| 34 | FMO | 2 |
| 35 | Fuehrer Capital Pvt. Ltd. | 1 |
| 36 | FWWB | 15 |
| 37 | Global Access Fund | 1 |
| 38 | GOJO & Co. | 5 |
| 39 | Grip Invest Technologies Pvt. Ltd. | 2 |
| 40 | Group Funding | 1 |
| 41 | Grow Money Capital Pvt. Ltd. | 2 |
| 42 | Hindon Mercantile Ltd. | 5 |
| 43 | Hinduja Leyland Finance Ltd. | 5 |
| 44 | Homeshree | 1 |
| 45 | ICON Financial Services Pvt. Ltd. | 1 |
| 46 | IKF Finance Ltd. | 4 |
| 47 | Jackson Commercial Pvt. Ltd. | 1 |
| 48 | Jalan Chemical Industries Pvt. Ltd. | 1 |
| 49 | Jeevan Utthan Financial Services Pvt. Ltd. | 2 |
| 50 | JM Financial Ltd. | 2 |
| 51 | Kaleidofin Capital Pvt. Ltd. | 5 |
| 52 | Kashi Vishwanatha Vidya Samasthe | 1 |
| 53 | Kiara Micro Credit Pvt. Ltd. | 2 |
| 54 | Kisetsu Saison Finance (India) Pvt. Ltd. | 3 |
| 55 | Kissandhan Agri Financial Services Pvt. Ltd. | 2 |
| 56 | Kiyansh Finance Pvt. Ltd. | 2 |
| 57 | Kula Loans International | 1 |
| 58 | L&T Financial Services Ltd. | 22 |
| 59 | Loan from Directors | 1 |
| 60 | Loan from Directors & Relatives | 1 |
| 61 | Loan from Financial Institution | 1 |
| 62 | Loan from Members & Relatives | 1 |
| 63 | Loan from Promoters & Relatives | 1 |
| 64 | Loan from Shareholders (Unsecured) | 1 |
| 65 | Loans from Promoters | 2 |
| 66 | Manaveeyaa Development and Finance Pvt. Ltd. | 15 |
| 67 | Manba | 1 |
| 68 | MAS Financial Services Ltd. | 20 |
| 69 | Masala Investments Sarl (NCD cum Subdebt) | 1 |
| 70 | Members & Public | 1 |
| 71 | Microfinance Solidaire | 1 |
| 72 | Milap | 2 |
| 73 | MK Venture Capital Pvt. Ltd. | 3 |
| 74 | Moneywise Financial Services Ltd. | 4 |
| 75 | Moringaway | 1 |
| 76 | Muthoot Microfin Ltd. | 3 |
| 77 | N+1 Capital Ltd. | 1 |
| 78 | NABFINS Ltd. | 31 |
| 79 | Nabkisan Finance Ltd. | 5 |
| 80 | Nabsamruddhi Finance Ltd. | 1 |
| 81 | National Co-Op Development Corporation | 1 |
| 82 | National Scheduled Castes Finance and Development Corporation (NSFDC) | 1 |
| 83 | Navachetana Vividodesh Souharda Sahakari Niyamit | 1 |
| 84 | NCD Application | 1 |
| 85 | NCD issued to Promoters and Others | 1 |
| 86 | NDC | 1 |
| 87 | Nederlandse Financierings-Maatschappij voor Ontwikkelingslanden N.V. (FMO) | 1 |
| 88 | NEDFI | 5 |
| 89 | Neeva Swarnam Pvt. Ltd. | 3 |
| 90 | Nipha Finance Pvt. Ltd. | 1 |
| 91 | NKC Finance Pvt. Ltd. | 2 |
| 92 | Northern Arc Capital Ltd. | 20 |
| 93 | Nova Vyapar Pvt. Ltd. | 1 |
| 94 | Others | 5 |
| 95 | Oxyzo Financial Services Pvt. Ltd. | 4 |
| 96 | Pahal Financial Services Ltd. | 1 |
| 97 | Piramal Capital & Housing Finance Ltd. | 3 |
| 98 | Poonawalla Fincorp Ltd. | 3 |
| 99 | Private Finance | 1 |
| 100 | Project Amon SCB (ECB) | 1 |
| 101 | RAI Finance Ltd. | 19 |
| 102 | Real Touch Finance Ltd. | 8 |
| 103 | ResponsAbility | 2 |
| 104 | Retail Investor | 1 |
| 105 | Ricavi Finance Ltd. | 3 |
| 106 | Rockland Finstock Ltd. | 2 |
| 107 | Rotary Fund | 1 |
| 108 | Samanthah Finance Ltd. | 2 |
| 109 | Samunnati Financial Intermediation & Services Pvt. Ltd. | 9 |
| 110 | SAS Finserv Pvt. Ltd. | 1 |
| 111 | SAS Infotech (inter corporate loan) | 1 |
| 112 | Save Solutions Pvt. Ltd. | 2 |
| 113 | Saving & Deposit from Borrowers/Public | 1 |
| 114 | Share Bazar Financial Services Ltd. | 1 |
| 115 | Shine Star Build Cap Pvt. Ltd. | 6 |
| 116 | Shriram Finance Ltd. | 15 |
| 117 | SMC Finance (Moneywise Financial Services Pvt. Ltd.) | 1 |
| 118 | Subhsherse Tradelink Pvt. Ltd. | 1 |
| 119 | Sumitomo Mitsui Banking Corporation | 1 |
| 120 | Sundram | 1 |
| 121 | Symbiotic AAV SARL and MIS SARL | 1 |
| 122 | Symbiotics South Asia Pvt. Ltd. | 2 |
| 123 | Tamilnadu Industrial Investment Corporation Ltd (TIIC) Ltd. | 1 |
| 124 | Tarangini Commercial Enterprises Ltd. | 2 |
| 125 | Tata Capital Financial Services Pvt. Ltd. | 4 |
| 126 | Tipsons Consultancy Services Pvt. Ltd. | 1 |
| 127 | Triple Jump | 4 |
| 128 | UC Inclusive Credit Pvt. Ltd. (UCIC) | 12 |
| 129 | United States Development Finance Corporation (DFC) | 1 |
| 130 | Usha Financial Services Pvt. Ltd. | 17 |
| 131 | Utthejana Trading and Services Pvt. Ltd. | 1 |
| 132 | Vedika Credit Capital Ltd. | 3 |
| 133 | Venus India Asset-Finance Pvt. Ltd. | 1 |
| 134 | Vivriti Asset Management Pvt. Ltd. | 17 |
| 135 | Western Capital Advisors Pvt. Ltd. | 12 |
| 136 | Whole Planet Foundation | 2 |
| 137 | Yunus Social Business Fund Bengaluru | 1 |
4.5.3 Capital to Total Asset Ratio
The Capital Adequacy Ratio (CAR) represents the ratio of an institution’s capital to its riskweighted assets, ensuring that MFIs can absorb losses and continue operations during stress. The Reserve Bank of India (RBI) mandates that NBFC-MFIs maintain a minimum CAR of 15%, with at least 10% as Tier I capital. This requirement ensures MFIs maintain adequate equity strength despite their reliance on unsecured lending. A strong CAR not only enhances resilience against credit risk but also instils confidence among lenders, investors, and regulators. For MFIs, compliance with CAR norms is essential to secure funding, expand outreach, and maintain long-term sustainability in a sector vulnerable to repayment shocks. Figure 4.5.11 indicates the median CAR for various MLI segments.
Figure 4.5.11: Capital to Risk-Weighted Asset Ratio


4.5.4 Leverage / Debt – Equity Ratio
The Debt-Equity ratio measures the extent to which MFIs finance their assets through borrowed funds compared to shareholders’ equity. Since MFIs primarily operate by mobilising debt from banks, NBFCs, and capital markets, a higher ratio reflects greater reliance on external borrowings. While leveraging debt helps expand outreach and scale loan portfolios quickly, excessive dependence on debt increases financial risk and vulnerability to interest rate fluctuations. Regulators and lenders often prescribe prudent debt-equity thresholds to ensure stability. Figure 4.5.12 depicts the median Debt-Equity ratio across segments.
Figure 4.5.12: Debt - Equity Ratio Trend and Break–up of FY2024-25 across MLI – Categories

Conclusion
The balance sheet and capital structure of Microlending Institutions (MLIs) reflect both their resilience and the challenges faced in a rapidly evolving regulatory and economic environment. The adoption of IndAS and principle-based auditing standards has improved transparency, accountability, and governance, while also increasing the responsibilities of auditors to assess qualitative aspects of financial management. Assets remain central to MFI operations, with loan portfolios driving income and other asset classes ensuring liquidity and stability. However, FY2024-25 witnessed a contraction in total assets, primarily due to a decline in lending portfolios, highlighting the sector’s vulnerability to external shocks.
On the funding side, both equity and debt flows showed significant declines, indicating cautious investor and lender sentiment. Equity outstanding continues to provide a foundation of financial strength, but the amount of fresh equity raised fell by nearly 28%, reflecting investor selectivity. Debt funding and borrowings also contracted sharply, driven by tighter credit, rising costs, and concerns over asset quality. These developments underscore the importance of prudent leverage, robust net owned funds, and compliance with CAR norms to ensure financial stability. In the future, MLIs must strike a balance between growth and risk management, strengthen stakeholder confidence, and diversify funding sources to sustain inclusive financial services.