
Chapter 4Operational Eminence of Micro Lending Institutions
In any financial institution, human resources form the backbone of operations, more so in microlending institutions (MLIs), which operate on a foot on street model. The frontline staff are crucial to MLIs in building client trust, ensuring repayment discipline, and supporting portfolio growth. The proper recruitment, training, and retention directly impact the efficiency and asset quality of the microfinance industry, making HR as vital as financial capital. However, while financial resources have received much attention, human resource development has often not been given due prominence. Many delinquency-related challenges stem from the staff practices shaped by their lack of understanding of the organizational mission, motivation, and client-centric approach. The challenge is further compounded as frontline staff, like their low-income clients, often have limited education and come from humble backgrounds and are lowly paid.


Operational Eminence of Micro Lending Institutions
4.1 Productivity of Workforce
4.1.1 Workforce in MLIs
In any financial institution, human resources form the backbone of operations, more so in microlending institutions (MLIs), which operate on a foot on street model. The frontline staff are crucial to MLIs in building client trust, ensuring repayment discipline, and supporting portfolio growth. The proper recruitment, training, and retention directly impact the efficiency and asset quality of the microfinance industry, making HR as vital as financial capital. However, while financial resources have received much attention, human resource development has often not been given due prominence. Many delinquency-related challenges stem from the staff practices shaped by their lack of understanding of the organizational mission, motivation, and client-centric approach. The challenge is further compounded as frontline staff, like their low-income clients, often have limited education and come from humble backgrounds and are lowly paid.
The microfinance industry has recently been struggling to find committed and skilled employees in an adequate number. In recent years, HR challenges have aggravated due to changes in work culture across industries, changes in expectations of the workforce, increased work opportunities, especially in urban setups in the form of e-commerce and gig economy. Reports say around 12 million people work in gig economy, comprising over 2% of the total workforce. However, microfinance has some advantages over gig employment. In microfinance, employment is generally more stable and institutionalised, with regular salaries, social security benefits, and opportunities for skill development. It enables individuals to contribute to community development and financial inclusion, providing a sense of purpose and long-term impact. While the rural workforce encompasses agriculture, informal sectors, and microfinance, employment in microfinance is likely a minimal share compared to these other sectors.
The microfinance employee base as of March 2025 is 3.29 lakhs, which is a 15% increase from the last year. The growth dropped to half from 33% during FY2023-24 to 15% in FY2024- 25. The total employee base of microfinance accounts for 0.06% of the total Workforce in India. The NBFC-MFI segment employs 77% of the total workforce, representing a 1% decrease from the last year.
1 https://www.livemint.com/money/personal-finance/indias-gig-economy-in-2025-growth-formalisation-and-financialinclusion-explained-11753438649777.html
2 Total labour force in India is 56.5 crores as per article: https://economictimes.indiatimes.com/budget-2024/economicsurvey-2024/economic-survey-2024-57-3-per-cent-of-the-total-workforce-self-employed-18-3-per-cent-working-as-unpaidworkers/articleshow/111920479.cms?from=mdr
Figure 4.1.1: Number of MLI staff – Yearly trend and MLI-category-wise Break-up


The Loan officers, who form the base of the organisational hierarchy of a typical microfinance organisation, are instrumental in expanding the outreach of microfinance and building goodwill with microfinance clients. Microfinance has always been a hightouch activity, with personal contact playing a crucial role in delivering financial services to low-income clients. Human relationships and values such as trust and empathy are essential in determining the growth and sustainability of a Microfinance Institution. The MLIs’ frontline staff—the loan officers and other field staff—must uphold the values and maintain relationships with their clients, being the face for the MLIs to their borrowers. The Loan officers hold a critical position in influencing clients’ experiences with access to credit and their engagement with an MLI.
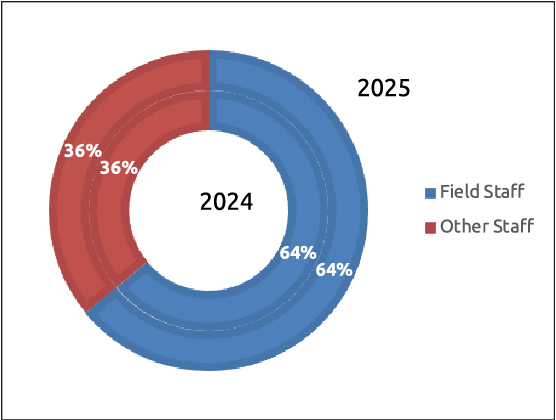
At the end of the last financial year, there were 2.09 lakhs field staff, which comprise 64% of the total staff. This ratio is unchanged from the last year. However, in terms of absolute numbers, the field staff has increased by 14%.
Figure 4.1.2: Distribution of staff in the last two years
Although microfinance borrowers are predominantly catering to women borrowers, the number being more than 95%, the share of women staff to the total staff in microfinance is very less. The primary reasons for the low share of women employees may be due to the rigours of microfinance operations, which include longer hours of operation, Societal restrictions on women’s mobility, concern for their safety, and lack of awareness regarding such work opportunities. Moreover, at the macro level, the participation rate of the female labour force in India at 35.6% is lower than that of men (77.5%) as per 2023-24 data3 . As of FY 2024-25, the microfinance industry employs a total of 30,725 female employees, of which 54% are field staff. However, this accounts for only 9% of the total employee base in the Microfinance Industry, which has been showing a steady declining trend from 2014 onwards, as can be seen from table 4.1.1.
Table 4.1.1: Year-wise staff strength in MLIs and share of women staff
| Year | Total Staff (in lakh) | Women Staff (in lakh) | % of Women Staff to Total Staff |
|---|---|---|---|
| 2014 | 0.80 | 0.15 | 19% |
| 2015 | 0.95 | 0.15 | 16% |
| 2016 | 1.03 | 0.16 | 15% |
| 2017 | 0.90 | 0.11 | 12% |
| 2018 | 1.11 | 0.13 | 12% |
| 2019 | 1.38 | 0.16 | 12% |
| 2020 | 1.52 | 0.17 | 11% |
| 2021 | 1.61 | 0.17 | 10% |
| 2022 | 1.95 | 0.25 | 13% |
| 2023 | 2.16 | 0.26 | 12% |
| 2024 | 2.87 | 0.31 | 11% |
| 2025 | 3.29 | 0.31 | 9% |
There are many challenges that an MLI faces in recruiting and retaining the right kind of human resources, such as finding qualified and motivated candidates, skilling them and managing their motivational level, which can withstand the competitive demands of other sectors. Over the last financial year, the sector recruited 2.06 lakh new staff, representing a 22% increase from the previous year. The NBFC-MFIs recruited 77% of the new staff, and 77% of these staff members were placed in the very large (portfolio above ₹2,000 cr).
Figure 4.1.3: New Staff Recruitment and their break-up based on Legal Form and Size


3 Periodic Labour Force Survey (PLFS) Annual Report [July 2023 – June 2024].
Attrition of staff has become a significant concern for the MLIs’ operations. This is more so in recent days, especially after Covid pandemic, the movement of staff has been seen much sharper. In some cases, attrition is so high that the entire frontline staff is replaced in one or two years. Attrition is most commonly observed among entry-level staff, typically within the first three months. SaDhan’s internal study on the reasons behind high attrition reveals some key reasons, such as high work pressure and long working hours, both of which are attributed to increased delinquency in the sector. These issues, combined with the new opportunities that have emerged over the last few years, such as the gig economy and a shift in work culture worldwide, have fuelled the increase in attrition for the sector. According to a recent report by The Economic Times, the banking sector has witnessed a 103% attrition rate, while the NBFC segment has posted a 77% attrition rate7 as of end of December 2024. During the financial year 2024-25, the sector observed an overall attrition rate of around 52%.
Table 4.1.2: Staff Attrition across different categories during FY 2024-25
| Categories of institutions based on legal status and size of business | No. of staff at the beginning of the year (i.e., April’24) | No. of staff who left/dropped during the year | No. of new Staff recruited during the year | No. of staff at the end of the year (i.e., March 25) |
|---|---|---|---|---|
| Staff Attrition across Legal Form of MLIs | ||||
| NBFC-MFIs | 2,22,186 | 1,27,326 | 1,58,827 | 2,53,687 |
| NBFCs | 27,303 | 14,499 | 29,580 | 42,384 |
| Pvt. & Pub Ltd. Coms | 21,734 | 16,572 | 16,341 | 21,503 |
| Sec. 8 Coms | 1,423 | 483 | 534 | 1,474 |
| Other NGO-MFIs | 10,546 | 918 | 793 | 10,421 |
| Total | 2,83,192 | 1,59,798 | 2,06,075 | 3,29,469 |
| Staff Attrition across Size of MLIs | ||||
| ≤100 Cr. | 7,311 | 3,011 | 4,068 | 8,368 |
| ₹100 Cr.–₹500 Cr. | 22,181 | 13,926 | 14,637 | 22,892 |
| ₹500 Cr.–₹2000 Cr. | 37,092 | 23,999 | 28,654 | 41,747 |
| ≥2000 Cr. | 2,16,608 | 1,18,862 | 1,58,716 | 2,56,462 |
| Total | 2,83,192 | 1,59,798 | 2,06,075 | 3,29,469 |
There is an employee bureau set up by Equifax India in 2017 for the microfinance industry, which is quite a unique initiative. This is part of Equifax’s India Workforce Solutions (IWS) offering, allows MFIs to access real-time, non-finance employment data to improve hiring quality and prevent fraudulent activities among their large, mobile, and primarily field-level workforce. Around 77% reported MLIs (100 out of 130) are participating in the bureau by sharing information and using it for background checks during staff onboarding.
4 https://economictimes.indiatimes.com/jobs/hr-policies-trends attrition-rate-surges-among-junior-staff-in-private-banks/ articleshow/117992846.cms?from=mdr
4.1.2 Staff Productivity
Active Borrowers per Credit Officer (ABCO) and Active Borrowers per staff (ABS)
Over the last two decades, the sector has undergone an operational shift, as most microlending institutions (MLIs) have transitioned from paper-based operations to digital by implementing Management Information System (MIS) and core banking solutions (CBS). Many of the MFIs have also adopted digitalisation of field service and complementary back-office operations through Digital Field Applications (DFAs), which facilitate onboarding, loan applications, account opening, and transactions in the field. Some of the MLIs have also moved into the next phase of digitization by involving AI and agent AI tools. Digitisation of the process has clear value for MLI as it increases staff productivity and improves the end customers’ experience. Despite these developments, the involvement of human resources is still important in various microfinance processes. Hence the enhancing the productivity of the human resource is important in improving the profitability of the operations. An efficient and productive staff will contribute to the growth of the MLIs
The primary indicator for assessing staff performance is to understand the number of borrowers each loan officer is responsible for handling. However, even with the increased inclination towards innovative technology, the Average Borrower per Credit Officer (ABCO) (ABCO) is moving downward. There could be several reasons why MLIs are unable to fully leverage technology. Some of these reasons are an increase in delinquency, which forces loan officers to spend more time on each repayment collection, stricter underwriting norms, which have reduced the active borrower base over the last year, an increase in rejection rate of borrowers’ applications, forcing them to spend more time on sourcing, which leads to a decrease in borrowers per loan officer.
During the financial year, we see a change in the composition of MLIs under each bucket of ABCO and Average Borrower per Staff (ABS). For ABS, a significant increase in the 100- 200 bucket is seen. In the case of ABCO, a substantial increase is observed in the lowest two buckets, i.e., the categories ‘less than 200 ‘and ‘200-300’ buckets. The share of MLIs under the ‘100-200’ bucket for Looks different font. Please correct it.
Over the financial year 2024-25, the ABCO decreased by 21%, marking the lowest ABCO recorded over the last five years. Similarly, ABS also experienced a significant decrease, from 243 to 190, resulting in a 22% drop.
Figure 4.1.4 Distribution of MLIs based on clients served per Staff and Credit Officer


Figure 4.1.5: Trends of ABCO Across MLIs and break-up of 2025 in terms of Legal Form and Size


Figure 4.1.6: Trends of ABS Across MLIs and break-up of 2025 in terms of Legal Form and Size

4.1.3 Distribution of MLIs Based on Loan Portfolio per Credit Officer
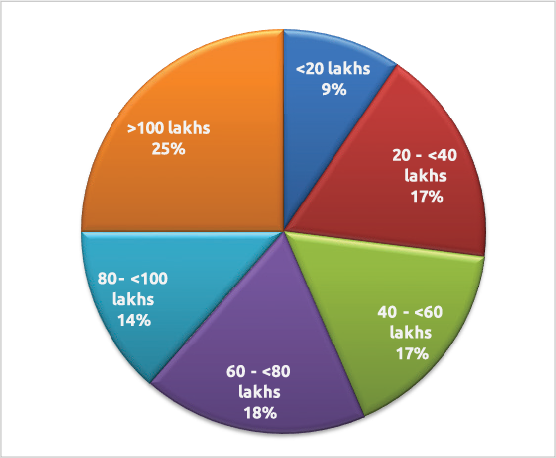
The portfolio outstanding under each loan officer is also a key indicator of staff productivity. It shows the workload and capacity of individual loan officers. The current year recorded an overall ₹1.14 crore portfolio handled by each loan officer. The distribution of MLIs across each bucket of the portfolio per loan officer has remained almost unchanged compared to last year. However, we see a decrease in the ‘>100 lakhs’ category from 74 to 50 and a slight increase in the ‘20- 40 lakhs’ category from 24 to 35 MLIs.
Figure 4.1.7: Distribution of MLIs Based on Loan Portfolio per Credit Officer
Conclusion
The workforce remains the cornerstone of operational excellence in microfinance institutions. Despite steady growth in employee numbers, the sector continues to grapple with high attrition, low female participation, and the challenge of balancing field-level demands with employee motivation and retention. Loan officers, who are central to client engagement and repayment discipline, face increasing workload pressures amid rising delinquencies. While digitisation has improved processes, productivity indicators such as ABCO and ABS have declined, reflecting the strain on field operations.
These trends underscore the urgent need for stronger human resource strategies—focused on recruitment, retention, capacity building, and gender inclusivity—alongside effective use of technology to enhance efficiency. For MLIs, sustaining growth and maintaining portfolio quality will depend as much on strengthening human capital as on financial capital.
Chapter 4: Section II
Asset Quality in MLIs
n a recent report by CRISIL Ratings , it was highlighted that Asset quality, Capitalisation, Earnings, and Resource profile are considered the core parameters for assessing the credit risk profiles of financial institutions. Asset quality indicates the risk levels at which a FI is operating. In contrast, capitalisation indicates the cushion available to absorb potential losses that may arise due to the risks taken and to ensure growth. Weakening in asset quality can erode earnings and, consequently, the capital cushion available to absorb losses, while adequate capitalisation can help absorb losses and ensure sustainable loan growth. Earnings indicate the ability to appropriately price risks and generate risk-adjusted returns, thereby augmenting the capital base. The resource profile is determined by the cost and stability of funds, which are key to ensuring smooth functioning and maintaining operational stability.
In the previous chapter, the resource profile in terms of the employee base of the MLIs, which is essential for maintaining operational stability, was covered. In this chapter, the asset quality of the microfinance industry is discussed. The other aspects, such as earnings and cost structure, will be addressed in the subsequent chapters. The trend of the portfolio at risk (PAR) for the overall sector is discussed in detail in Chapter 2. Here, the details of the trends of PAR values of MLIs (NBFC-MFIs, NBFCs and NFPs) over their overall portfolio (this includes the managed portfolio of the FI as well) is covered.
Various studies over the years have established a direct relationship between asset quality and the performance of financial institutions (FIs). The graphs below (Figure 4.2.1), indicates that PAR>30 dpd has increased to 7.52% at the end of the financial year 2024-25. The upward trend of PAR > 30 began in June 2024 and reached its peak by the end of March 2025. This year, particularly, was stressful for the microfinance industry due to various external and internal issues. The industry has experienced an increase in borrowers’ indebtedness at the end of FY2023-24, which was a result of a combination of many factors, such as pent-up demand following the pandemic, among other reasons. In addition to these, external factors such as heatwaves, prolonged general elections, and loan waiver movements like the Karz Mukti Abhiyan impacted the collection efficiency. These challenges are further aggravated by the weakening of the Joint Liability Group model, characterised by a notable decrease in centre meeting attendance and diminished peer pressure and collective accountability, which have historically helped maintain low default rates. Additionally, high attrition rates among field staff present operational hurdles, as frequent turnover disrupts client relationships and hampers loan recovery efforts. All these contributed to the upward trend of the delinquency rate.
4https://www.crisilratings.com/mnt/winshare/Ratings/SectorMethodology/MethodologyDocs/criteria/Criteria%20for%20 Banks%20and%20Financial%20Institutions%20(including%20approach%20for%20financial%20ratios)_1603.pdf
2 All overdues above 30 days.
Figure 4.2.1: MLI Loan Portfolio at Risk (PAR)

The delinquency data of individual institutions show that there was an upward trend in delinquency during the year. The distribution of the MLIs having PAR values >30 dpd is presented in Figure 4.2.2. In the FY 2023-24, the number of MLIs was skewed towards the lower PAR values. However, this year it is observed that there was a double skew both towards lower values and higher values, but with a greater skew towards higher PAR values, with a median value of 5.44%.
Figure 4.2.2: Distribution of MLIs Based on PAR

In Figure 4.2.3, a similar trend, such as PAR > 30 dpd, can be observed in all buckets. However, the slope of the different buckets is different. PAR > 30 dpd witnessed the steepest slope, and PAR > 180 dpd witnessed the comparatively flatter slope. PAR > 60 and PAR > 90 saw a similar slope to PAR > 30 dpd. This shows a sharp re-emergence of repayment stress across all buckets, with early delinquency leading the way. SROs are working closely with sector leaders, the regulator, and other stakeholders to monitor this trend, ensuring it does not escalate into an NPA crisis in 2026.
Figure 4.2.3: Portfolio quality at various overdue buckets based on weighted average values

The overall PAR values for various portfolio sizes are presented below. The data, based on different legal forms for two buckets, PAR > 30 dpd and PAR > 60 dpd, is presented in Fig. 4.2.4. The rise in PAR values, based on different portfolio sizes, was not as sharp. The large MLIs observed the highest increase to 9.25%, which also includes a portion of 180+dpd that was not written off.
Figure 4.2.4: Size-wise Portfolio quality (based on all overdue, including overdue above 179 days)3 - Weighted average value

According to the regulations, PAR exceeding 180 days has to be fully provided for. As a result, most of the amount exceeding 180+dpd have been provided, and most of them have also been written off. But in the credit bureau, it continues to be there, thereby having a higher PAR value for the PAR above 180+ days
Conclusion
The rising PAR values across all delinquency buckets in FY2024–25 point to mounting stress in the microfinance industry. Borrower over-indebtedness, socio-political disruptions,weakening of the Joint Liability Group model, and high staff attrition have collectively driven this trend.
Larger MLIs have seen the sharpest deterioration, highlighting systemic vulnerabilities. While stronger players show some resilience, the overall skew towards higher PAR values raises concerns of a potential NPA crisis if left unchecked. Proactive measures in credit discipline, staff retention, and portfolio monitoring are essential to safeguard asset quality and sector stability.
³ It needs to be noted that the overdue amount, which is above 180 days, does not include the technical write-off amount; therefore, it may look lower than the data mentioned in Chapter 2
Chapter 4: Section III
Income and Expenditure Analysis
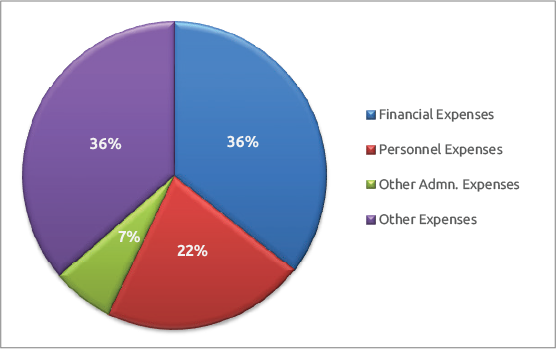
aintaining sound financial health is essential for the long-term sustainability of financial institutions, particularly microlending institutions (MLIs). Rising delinquencies pose a significant threat, resulting in substantial financial losses and multiple structural challenges. Higher credit costs translate into heavier provisioning burdens, while unpaid loans reduce net interest income and restrict lending capacity, directly curbing growth and profitability. At the same time, intensified recovery and monitoring efforts drive up operational expenses, further straining margins. Persistently high delinquency levels can also erode the confidence of lenders and investors, jeopardizing access to fresh capital and bank funding—risks that are especially pronounced for smaller MFIs. component contributes to 22% of the total expenses this year. The same trend is prevalent across various size segments. The trend in the first quarter of the FY 2025-26 also indicates a similar trend. It appears that this trend may persist in the first half of FY 2025-26
Figure 4.3.1: Breakdown of expenses under various categories by MLIs
4.3.1 Expenditure Analysis
Since MLIs in India are not permitted to take deposits, the microfinance model is heavily dependent on raising debt funds from Banks for on-lending. Therefore, the significant component of MLIs’ cost structure is financial cost. The finance cost is followed by personnel (human resources) cost, as the model is heavily labour-intensive due to the door-todoor collection method. However, for the FY 2024-25, this composition changed due to an increase in Loan Loss Provision Expenses. This An analysis of different legal forms indicates a change in the composition of expenses, especially in the case of ‘Pvt & Pub Ltd Coms. For this segment, the most significant expense is personnel cost. These types of MLIs only operate as Business Correspondents as per the guidelines shared by the Ministry of Corporate Affairs, and hence, there is no financial cost, as they incur little cost to raise funds. Interestingly, a similar trend can be observed in the case of Section 8 companies, too.
Figure 4.3.2: Break up of expenses by Indian MLIs based on portfolio size and legal form


4.3.1.i Operating Cost1
Operating costs play a critical role in shaping the pricing structure of MLIs, as they directly influence the interest rates and fees charged to borrowers. Since these institutions function on narrow margins, any increase in cost is often transferred to clients, raising their repayment burden and affecting institutional self-reliance. A lower operating cost ratio signals higher efficiency, enabling MLIs to provide affordable loans, improve competitiveness, and extend outreach. In contrast, rising costs diminish lending capacity, squeeze profitability, and risk, pushing institutions toward donor dependence. Over the past five years, operating costs hovered around 6-7%, largely driven by elevated delinquencies, staff attrition, and efforts to expand into underserved markets.
Figure 4.3.3: Trends of Operating Cost across MLI Categories


1 Define as (Personnel Cost including incentive + Travel Cost + Admin Cost + Group Dev. Cost/Training Cost + Depreciation + Any Others)/Average Portfolio Outstanding.
4.3.1.ii Finance Cost2
Finance costs are equally decisive, as they determine both lending rates and the extent of outreach. Persistently high finance costs leave MLIs with limited flexibility, often compelling them to raise interest rates, which reduces affordability and can also strain repayment behaviour. In contrast, periods of declining finance costs have allowed institutions to price loans more competitively, strengthen repayment discipline, and broaden their client base. Lower borrowing costs have also supported better margins, enabling MLIs to build reserves and reinvest in growth. Conversely, elevated finance costs have curtailed expansion, undermined profitability, and increased dependence on subsidies or external donor support. Between 2018 and 2025, managing finance costs has remained central to balancing financial sustainability with client affordability, underscoring its role as a cornerstone of microfinance operations.
Figure 4.3.4: Trends of Finance Cost across MLI Categories


4.3.1.iii Trends of OperatingCost and Finance Cost
Finance costs and operating costs have consistently played a significant role in determining portfolio quality, as measured by PAR exceeding 30 days. High costs increase the pressure on MLIs to charge higher interest rates and fees, which in turn reduces borrower repayment capacity and raises delinquency risk. Conversely, when costs have been better controlled, institutions have been able to maintain more affordable lending terms and support the health of their portfolios. In 2021– 22, despite moderating finance costs, high operating costs and overall expense pressures coincided with the covid pandemic, made a surge in PAR to above 7%, indicating weakened borrower repayment capacity. In 2023–24, both costs stabilized, and PAR dropped to below 3%, highlighting how efficiency gains supported repayment discipline and portfolio health. By 2025, rising finance costs (11.5%) and operating costs (7.09%) again pushed PAR up to 7.52%. This demonstrates that cost control is essential not just for profitability but also for credit risk management.
2 Define as the Total expense incurred for acquiring funds /Average Outstanding Borrowings
4.3.1.iv Cost per borrower
An analysis of MLIs’ income and cost structure from the perspective of cost and income per active borrower can help to understand the sustainability of the income-cost structure of the MLI. For Micro Lending Institutions (MLIs), cost per borrower is a critical indicator of operational efficiency, sustainability, and ability to serve clients effectively. A lower cost per borrower suggests the MLI is efficient in its operations and can potentially offer lower interest rates or greater outreach to the poor. Conversely, a high cost per borrower may signal inefficiencies that hinder expansion, require higher interest rates to remain viable, or limit financial inclusion
The data shows that MLIs face a narrow margin3 between expenses4 (₹5,861) and income5 (₹5,780) per borrower, reflecting overall financial strain. Expenses per borrower vary widely across institutions, shaping efficiency and risk. NBFC-MFIs incur the highest costs (₹7,628), reflecting fieldintensive operations and compliance needs, but such high expenses pressure margins and borrower affordability. NBFCs (₹1,483) and Section 8 companies (₹1,261) show far leaner models, indicating stronger cost efficiency. Smaller MFIs (<₹100 cr) manage relatively low expenses (₹4,758), while mid-sized and large MFIs see rising costs above ₹6,000 per borrower, suggesting diseconomies of scale. Overall, higher expenses often result in thinner surpluses, repayment stress, and increased credit risk.
Figure 4.3.5 Expenses per borrower under various categories

4.3.2 Income Analysis
The primary source of income for MLIs is the interest earned on their loan portfolios, supplemented by various fees and commissions, including service charges, processing fees, and revenues from non-credit products. Profitability depends on the ability to generate sufficient revenue to cover both operating and financial costs, with interest, fees, and commissions historically forming the bulk of financial income. However, this heavy reliance on loan-related revenue poses a challenge: any increase in expenses can be offset only in two ways—either by raising interest rates, fees, or commissions (which directly increases the burden on borrowers), or by incurring losses. Consequently, understanding and analysing the revenue streams of MLIs is crucial for institutions aiming to strengthen profitability, diversify income sources, and reduce overdependence on borrowers. The total revenue generated by MLIs during FY2024-25 is ₹36,221 crores, out of which 81% is from interest income from the loan portfolio. The total income has increased by 10% from the income of FY2023-24, which is lower than the growth rate of FY2023-24 (18%).
3 Margin here refers to the difference between expenses per borrower and income per borrower.
4 Calculated as aggregated total expenses (finance, human resource, admin and other expenses) of all MLI divided by the total active borrower.
5 Calculated as aggregated total income of all MLIs divided by total active borrowers.
Figure 4.3.6: Break-up of Income

4.3.2.i Yield on Loan Portfolio
Yield is a vital indicator in microfinance as it reflects both sustainability and efficiency. Since MLIs provide small, collateral-free loans to low-income clients, operating costs and risks are high. Yield ensures that institutions earn sufficient interest and fees to cover expenses, absorb credit risks, and maintain investor confidence. It also serves as a benchmark for efficiency, highlighting whether operations are sustainable and efficient. However, yields must strike a balance between financial viability and client affordability, as excessively high rates undermine the social mission of microfinance Thus, yield is central to ensuring both growth and responsible financial inclusion. Historically, over the last two decades, yield has been mostly between 20-22%.
The industry experienced its lowest yield between 2020 and 2022, a result of the pandemic’s shock. Following two years, i.e., 2022-2023 and 2023-24, the yield returned to the pre-COVID level. However, in FY2024- 25, it again fell behind. This highlights the challenges faced by the MLIs during the year (2024-25) in terms of external shocks such as climate change, loan waiver rumours, and internal issues like repayment stress, higher attrition, etc.
Figure 4.3.7: Yield Trend of MLIs

A similar trend of lower yield compared to the previous year (FY2023-24) prevails for different legal types and sizes of MLIs.
Figure 4.3.8: Yield on Portfolio across MLIs


4.3.3 Margin
The Financial Margin is calculated as the difference between the Yield and the cost of borrowing. The spread between yield and finance cost covers the operational cost, including loan loss provisions, other expenses and net profit margin. The margin covers the operating cost and the profit margin of the MLI. The weighted average Margin in FY2024- 25 stands at 7.99%, which is very small for an industry like microfinance, where the operational cost and risk cost tend to be high.
Figure 4.3.9: Yield, Cost and Margin of MLIs – size-wise based on weighted average values

Conclusion
The analysis of income and expenditure highlights the fragile balance that microlending institutions must maintain between financial sustainability and social outreach. Rising delinquencies, high finance costs, and escalating operating expenses have intensified pressure on margins, leaving institutions with little room to absorb shocks. The cost per borrower remains elevated for many categories, eroding efficiency and threatening borrower affordability, while income streams remain heavily concentrated in interest earnings, underscoring the vulnerability to repayment stress. The fluctuating yield trends and shrinking margins further emphasise the need for stronger cost controls, income diversification, and operational innovations. Ultimately, the long-term resilience of MLIs depends on their ability to optimise expenses, stabilise income, and maintain affordable credit access, ensuring both institutional sustainability and meaningful financial inclusion.
Chapter 4: Section IV
Self-Sustainability and Profitability
The Indian microfinance faced the dilemma of achieving the social objectives and making profit. It has always tried to balance both so that the institutions remain strong and capable to deliver credit and at the same time support the clientele who are from the weaker sections in their social needs.
The impressive growth of the microfinance sector has been driven by regulatory reforms, technological innovations, and government support, enabling millions of low-income households—once excluded from formal financial services—to access credit. However, the sector still faces significant hurdles, including limited access to affordable capital, low financial and digital literacy, and growing risks related to data security. Self-sustainability in microfinance reflects the ability of MLIs to remain financially viable and operationally resilient while serving marginalized communities without dependence on subsidies or grants. It requires balancing revenue generation with cost efficiency, safeguarding portfolio quality, diversifying products, and effectively managing interest rates.
4.4.1 Surplus
At the end of the FY2024-25, around 15% of MLIs posted a negative operating profit and 25% of the reported MLIs posted a negative surplus. The aggregated operating profit recorded for FY 2024-25 is ₹8,171 crores with a net surplus of negative ₹612 crores. The negative net surplus impacts the sustainability of the organisation by eroding its capital base, thereby weakening its ability to absorb shocks. NBFC-MFIs and Limited Companies registered a negative net surplus of ₹669 crores and ₹168 crores, respectively. A negative net surplus also raises concerns about sustainability, making it more challenging to attract investment. During the financial year, only small and large MLIs were able to maintain a positive net surplus of ₹8.24 crores and ₹209.05 crores, respectively. Thus, the net position concerning the surplus based on the data received by Sa-Dhan for this BMR compilation indicates negative (-)₹669 crores as against ₹3,139 crores in the previous year, 2023-24.
4.4.2 Operational Self Sufficiency (OSS1)
Operational Self-Sufficiency is a financial metric for Microlending Institutions (MLIs) that measures their ability to cover total operational, financial, and loan loss costs by the operating revenue from interest, fees, and commissions received by them during a year. Its importance lies in its role as a key indicator of an MLI’s ability to become financially sustainable, grow, expand its outreach, and serve underprivileged populations. However, the dual role of an MLI in furthering affordable credit to low-income households and maintaining a self-sustainable income makes it challenging for the MLIs. The financial year 2024-25, in particular, tested MLIs’ long-term self-sustainability while providing credit at an affordable price. The aggregated OSS for the industry in FY 2024-25 is 104% (mentioned in Figure 4.4.1). This shows that the MLIs barely managed to cover all their expenses from the income received during the year. From Figure 4.4.1, it is evident that this is the lowest OSS over the last 8 years and is almost at the level of FY2020-21, which was the pandemic year. At the individual institution level, six institutions reported an OSS below 100%, indicating that their income was insufficient to cover their total expenses.
Figure 4.4.1: Average OSS of MLIs over the years and its break-up between various categories


There is a direct relation between average loan outstanding per borrower and OSS. It has been observed that higher average loan balances contribute to higher revenue, potentially boosting OSS by increasing operating income. However, this must be balanced against the risk and efficiency implications of lending larger amounts, which could also increase operating costs and negatively impact OSS.
Figure 4.4.2 depicts the change in OSS for various average loan outstanding buckets.
Figure 4.4.2: OSS based on average loan size

Operational Self-Sufficiency (OSS) and yield share a positive relationship only up to a certain threshold; after this threshold, higher yields result in diminishing sustainability. As observed, OSS rises with yields between 15–30%, reflecting increased revenue to cover operating and financial costs. However, when yields exceed 30%, OSS declines. This is because higher interest charges often accompany higher operational complexities, credit risks, and borrower defaults. Excessive repayment burdens can weaken portfolio quality and increase loan losses, eroding financial gains. Additionally, reputational and regulatory pressures associated with high pricing add to costs. Thus, beyond a point, higher yields undermine efficiency and sustainability.
Figure 4.4.3: OSS based on yield category

4.4.3 Profitability Ratios
Return on Assets (RoA2 ) measures how efficiently a Microlending Institution (MLI) generates profit from its total assets. In contrast, Return on Equity (RoE3 ) measures how effectively a company generates profit for its shareholders’ investments. Both are crucial for assessing an MLI’s financial health and management effectiveness, with ROA indicating operational efficiency across all resources and ROE highlighting the returns on investment for shareholders. These are important in the view of attracting debt or equity funding. Analysing ROA and ROE together reveals the impact of leverage (debt) on profitability, providing a comprehensive view of the MLI’s performance and sustainability. Figure 4.4.4 illustrates the distribution of ROA and ROE across various legal forms of MLIs, based on the weighted average value.
Figure 4.4.4: Return on Asset (RoA) and Return on Equity (RoE) across MLI types

FY 2024-25 saw a drop in RoA and RoE in all legal forms and sizes. Figure 4.4.5 indicates the changes in RoA and RoE over various sizes of MLIs.
Figure 4.4.5: Return on Asset (ROA) and Return on Equity (ROE) of MLI: Size-wise

2 RoA = Net Profit/Average Asset
RoE = Net Profit/Average Equity
Conclusion
The analysis of self-sustainability and profitability in Indian microfinance highlights both resilience and challenges. While regulatory support and innovation have enabled outreach, negative surpluses and declining profitability ratios pose a threat to long-term stability. Operational Self-Sufficiency at 104% shows that institutions are only marginally covering costs, with some falling short. The fall in RoA and RoE underscores pressure on efficiency and shareholder returns. Sustaining growth will require MFIs to enhance portfolio quality, diversify income, and control costs while safeguarding affordability. Achieving balanced profitability is crucial for attracting investment, strengthening resilience, and continuing to serve low-income households sustainably.
Box 4.1: End-to-End Digital Transformation in Microfinance Lending
Midland Microfin Ltd., one of India’s leading microfinance institutions, exemplifies how responsible lending can be scaled up through digital transformation. By embracing modern technology across its operations, Midland has successfully built a digitally enabled, transparent, and customer-centric lending ecosystem.
Key Pillars of Transformation:
- End-to-End Digitization: From customer onboarding and credit appraisal to loan disbursement and repayments, Midland has digitized every step of the customer journey
- Customer Empowerment: Clients can now access financial services via mobile platforms, with minimal branch dependency.
- Responsible Lending Embeded: Transparency, affordability checks, borrower education, and data security are integral to every digital initiative.
- Increased Financial Inclusion: Technology enables outreach to underserved communities in rural and semi-urban areas, deepening financial access and trust.
Outcome and value added to the organization with the implementation of digital initiatives in FY 2024–25
1. Modern Cloud Infrastructure
The organisation has transitioned from traditional on-premises servers to advanced cloud-based platforms. This initiative has reduced dependency on physical infrastructure, improved scalability of operations, enhanced agility, and strengthened system availability, while also resulting in significant savings on infrastructure and maintenance costs.
2. Digital Communication Channels (WhatsApp, Chat-Bots, Alerts, Interactive Voice Response, and LED Displays)
Multiple digital communication platforms have been introduced to strengthen engagement with customers. Additionally, Panasonic LED display screens have been installed across branches for both internal and external communication. These measures enable real-time updates, build stronger customer connections, improve financial literacy, enhance brand visibility, and reduce communication costs.
3. Know Your Customer and Anti-Money Laundering Screening (Screenzaa Solution)
Customer due diligence processes have been reinforced by integrating screening against Politically Exposed Persons and global sanctions lists during customer onboarding. This ensures compliance with regulatory requirements, prevents onboarding of high-risk profiles, and increases transparency in customer verification.
4. Finconnect Customer Grievance Redressal Mechanism
A digital grievance redressal system has been deployed to ensure that customer complaints are resolved within one business day. This has considerably reduced turnaround time, strengthened adherence to service commitments, improved customer satisfaction levels, and lowered the manual effort and operational costs associated with complaint handling.
5. Information Technology Asset Management System
A centralized system has been implemented to monitor and manage the complete lifecycle of technology assets and inventories. The system provides visibility and control over assets, reduces redundancies, optimizes operational costs, and enhances audit and compliance readiness.
6. Midfin Customer Service Mobile Application Enhancements
The customer mobile application has been upgraded with additional self-service features. Customers can now apply for loans, track their loan status, make digital repayments, access multilingual support, and obtain digital receipts. These enhancements increase transparency and convenience, expand financial accessibility, and reduce dependency on physical branches.
7. Midfin Collection Tool
A specialized monitoring tool has been introduced to improve the management of nonperforming loans. It enables early identification of overdue accounts, tracks “Promise to Pay” commitments, and enhances visibility into arrears. This improves the efficiency of loan recovery and reduces the overall incidence of non-performing assets
8. Tableau Reporting and Analytics System
A centralized reporting and analytics platform has been adopted to provide comprehensive visibility of business data at all organizational levels. This system enables faster, data-driven decision-making, improves accuracy of reporting, and reduces reliance on manual reporting processes, thereby optimizing efficiency.
In addition to the above-mentioned initiatives, the company has identified several more digital interventions that will be taken up during this financial year to further strengthen efficiency and customer experience.
Midland Microfin Ltd. continues to pioneer responsible digital microfinance by merging innovation with inclusion. With a robust pipeline of digital initiatives, the company is setting new standards in customer experience, operational excellence, and ethical lending practices. The transformation is not just technological—it is social, sustainable, and scalable
Courtesy: Midland Microfin Ltd.
Chapter 4: Section V
Balance Sheet and Capital Structure
Since the Reserve Bank of India (RBI) introduced its revised framework in March 2022, microfinance institutions (MFIs) in India have undergone a fundamental transformation in their accounting and audit practices. Designed to harmonize regulations across all lenders engaged in microfinance, the framework moves away from a rigid, rulebased system toward more judgment-driven and principle-based standards.
A key development is the adoption of Indian Accounting Standards (Ind AS)1 for asset classification and income recognition. This has replaced the earlier system, which relied primarily on days past due metrics, with a forward-looking Expected Credit Loss (ECL) model. Under this approach, auditors must critically evaluate the statistical models, assumptions, and management judgments that MLIs use to estimate potential loan losses. Ind AS has also introduced the Effective Interest Rate (EIR) method, which requires institutions to account for upfront fees and transaction costs in a more nuanced manner, demanding accurate calculations and greater transparency in disclosures.
For auditors, these shifts significantly expand the scope of review. The focus is no longer limited to quantitative accuracy in financial statements but extends to qualitative aspects of governance and operational soundness. Greater attention must now be given to board approved policies on household income assessment, transparent loan pricing, and borrower protection. By doing so, auditors ensure not just compliance with financial reporting norms but also adherence to the RBI’s broader vision of responsible lending, customer care, and sustainable financial inclusion.
4.5.1 Assets of MLIs
Total assets represent the overall economic resources controlled by a microlending institution (MLI), reflecting its financial strength, operational scale, and capacity to serve clients. For MFIs, total assets are a key indicator of size and growth, as they determine the amount of lending the institution can undertake and its ability to expand outreach effectively. A larger asset base enhances credibility with investors, lenders, and regulators, enabling access to cheaper funding and greater sustainability. Moreover, monitoring total assets helps assess efficiency, resource allocation, and long-term viability. In essence, total assets embody the foundation upon which MLIs build inclusive financial services.
Figure 4.5.1 depicts the trend of total assets over the last fourteen years. An upward trend is observed over this period, except for FY2024-25, where it sharply slopes downward. This downward slope is mainly driven by the shrinkage in the overall portfolio of MLIs.
1 NBFC-MFIs need to use Indian Accounting Standards (Ind AS) if they are listed (or in the process of listing) with a net worth less than ₹500 crore, or if they are unlisted with a net worth of ₹250 crore or more but less than ₹500 crore, as well as their holding, subsidiary, joint venture, or associate companies.
Figure 4.5.1: MLI Total Assets- Yearly Trend

Distribution of Assets
Assets are central to the functioning of microlending institutions (MLIs), shaping both income generation and financial stability. The loan portfolio, which typically constitutes the largest share of assets, is the primary revenue driver, and its quality determines the sustainability of the organisation. Cash reserves and bank deposits provide liquidity for smooth operations and timely disbursements, while investments in secure instruments add income and mitigate risk. Fixed assets such as offices, vehicles, and IT systems support outreach and service delivery. Together, these assets strike a balance between profitability and resilience, ensuring that MFIs can effectively serve low-income clients while maintaining the confidence of investors and regulators.
Figure 4.5.2: Composition of Total Assets of MLIs

4.5.2 Funds for MLI operations
4.5.2.i Net Owned Fund
Net Owned Fund (NOF) is vital for MFIs as it reflects their core capital strength and capacity to absorb risks. A higher NOF enhances credibility with regulators, investors, and lenders, enabling greater borrowing and portfolio expansion. It serves as a cushion against loan losses and operational challenges, while also supporting growth, innovation, and long-term sustainability. The Net Owned Fund for the financial year 2024-25 is ₹33,189 crores
Equity Outstanding
Equity outstanding in microlending institutions (MLIs) refers to the total value of shares held by promoters, investors, and other shareholders. It represents the ownership capital that forms the foundation of an MLI’s financial structure. Equity is crucial because it provides permanent capital that strengthens the balance sheet, absorbs risks, and supports borrowing from banks and financial markets. Higher equity outstanding signals investor confidence and enhances the institution’s credibility, while also enabling regulatory compliance and portfolio expansion. For MLIs, strong equity levels are essential to sustain growth, attract funding, and ensure longterm financial stability in serving low-income clients.
Figure 4.5.3: MLI Equity Outstanding - Yearly Trend and MLI- Category-wise Break-up of March 2025


Fresh Equity Acquired
Strong financial performance, including consistent profitability and efficient cost management, forms the foundation for attracting investors. Equally important is robust asset quality, reflected in low delinquency and portfolio-at-risk levels, which signals lower credit risk. Adequate net owned funds and transparent governance practices enhance credibility with both regulators and investors. MLIs that demonstrate clear growth potential, adoption of technology, and measurable social impact are particularly attractive to equity investors. A proven management track record further reinforces confidence, making equity mobilization more effective. During the financial year 2024-25, total equity raised by the MLIs is ₹1,855 crores, which is 28% lower than the last year (FY 2023-24). Figure 4.5.4 gives a detailed breakdown of the fresh equity raised by the lenders in terms of legal form and size.
Figure 4.5.4: Fresh Equity Raised by MLIs and MLI-Category-wise Break-up

The top 10 MLIs in terms of fresh equity raised are listed in Figure 4.5.5. The top 10 MLIs contribute to the 92% equity raised during the year.
Figure 4.5.5: Top 10 MLIs in terms of Equity Raised

4.5.2.ii Debt Funding
Debt funding forms a critical component of an MLI’s capital structure, complementing equity and retained earnings to finance loan portfolios. It typically comprises bank loans, bonds, securitised debt, and borrowings from financial institutions or NBFCs. MLIs rely on debt because it allows them to scale outreach rapidly without diluting ownership, given that equity is often limited. The cost, tenor, and structure of debt directly affect an MFI’s interest rate policy, liquidity management, and overall profitability. Prudent debt management ensures sustainable growth, enabling MFIs to extend microloans to underserved populations while maintaining financial stability and regulatory compliance.
Debt funding for MFIs declined sharply from ₹1,30,096 crore in FY2023-24 to ₹85,877 crore in FY2024- 25, reflecting a reduction of around 34%. This drop is primarily due to tighter credit from banks and financial institutions, driven by cautious lending amid a rise in perceived riskiness of the sector. Regulatory constraints and prudential norms may have limited leverage, while lenders’ concerns over asset quality and macroeconomic risks further restrained funding. A breakdown of various sources of debt funding enjoyed by MLI during FY 2024-25 is given in Figure 4.5.6
Figure 4.5.6: Sources of funding based on types of instruments

Microlending Institutions (MLIs) rely on multiple borrowing sources to finance their lending operations and portfolio expansion. Banks are a key source, offering term loans, working capital, and overdrafts at competitive rates. Financial institutions and NBFCs offer structured loans or credit lines tailored to the growth needs of MFIs. Capital markets are increasingly used, with bonds and debentures enabling access to medium- and long-term funding. Securitisation of loan portfolios allows MFIs to convert receivables into immediate liquidity. Additionally, colending arrangements with banks help share risk while mobilising funds. These diverse sources ensure MLIs maintain liquidity, support outreach, and sustain operations efficiently. Figure 4.5.7 illustrates the source of funding for MLIs in FY2024-25, categorised by institution type.
Figure 4.5.7: Sources of funding based on Institution types
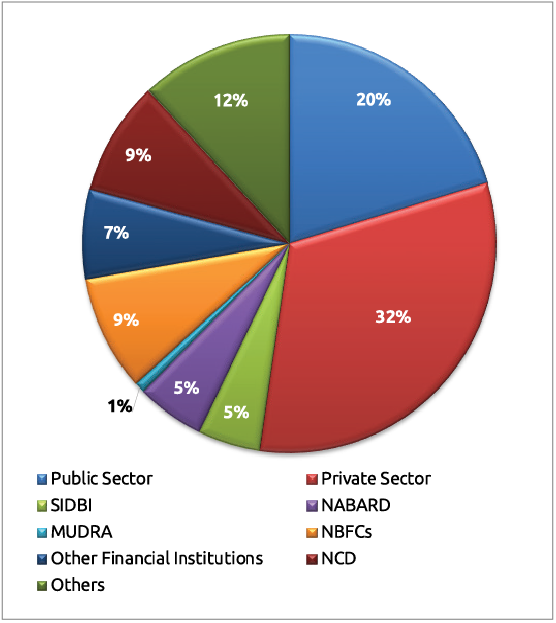
Figure 4.5.8 shows the trend of Borrowing Outstanding of MLIs over more than 10 years, along with legal-form and size-wise distribution for FY2024-25.
Figure 4.5.8: Outstanding Borrowings (₹ in Cr.)– Yearly Trend and MLI-Category-wise Break-up of 2025


Debt received by MLIs declined sharply from ₹1,05,306 crore in FY2023-24 to ₹58,046 crore in FY2024-25, representing a nearly 45% reduction. This significant fall can be attributed to multiple factors. Cautious lending by banks and financial institutions limited access to new debt. Higher borrowing costs made traditional loans less attractive, prompting MFIs to rely more heavily on alternative sources. Regulatory constraints and prudential norms further restricted leverage, while concerns over portfolio quality and potential NPAs made lenders wary. Additionally, MFIs have increasingly explored alternative financing options, such as BC and co-lending arrangements, thereby reducing their dependence on conventional debt sources. Figure 4.5.9 shows the borrowing received by MLIs based on legal form and size.
Figure 4.5.9: Fund Received during the year and MLI-Category-wise Break-up of 2025

Table 4.5.1 and Figure 4.5.10 below illustrate the debt received by MLIs from various source types.
Table 4.5.1: Source-wise and received by different entities during the year
| Public Sector Banks | Private Sector Banks | SIDBI | NABARD | MUDRA | NBFCs | Other Fin. Ints. | NCDs | Any Others | |
|---|---|---|---|---|---|---|---|---|---|
| NBFC-MFIs | 13,010 | 21,140 | 1,442 | 2,514 | 110 | 4,645 | 3,538 | 2,831 | 6,495 |
| NBFCs | 40 | 424 | - | - | - | 792 | 10 | 308 | 356 |
| Sec. 8 Coms | 53 | 23 | 1 | - | - | 10 | 3 | 1 | - |
| Others | 143 | 42 | - | - | - | 33 | 36 | - | 46 |
| Total | 13,246 | 21,629 | 1,443 | 2,514 | 110 | 5,480 | 3,587 | 3,140 | 6,897 |
Figure 4.5.10: Source-wise Share of Loans lent among Different Legal Forms of MLIs during 2024-25

Top Lenders to MLIs during 2024-25
The tables below list the major lenders (based on the information received for the top 10 lenders for each institution) that provide debt funds to MLIs.
Table 4.5.2 (a): List of banks that lent to MLIs as of March 2025 (Based on the Top 10 lenders out of the total)
| S. No. | Name of Lenders | No. of MLIs |
|---|---|---|
| 1 | Assam Gramin Vikash Bank | 1 |
| 2 | AU SFB | 5 |
| 3 | Axis Bank Ltd. | 9 |
| 4 | Bandhan Bank Ltd. | 9 |
| 5 | Bangiya Gramin Vikash Bank | 2 |
| 6 | Bank of Baroda | 18 |
| 7 | Bank of India | 21 |
| 8 | Bank of Maharashtra | 2 |
| 9 | Canara Bank | 8 |
| 10 | Capital SFB | 2 |
| 11 | Chandrapur District Central Co-Operative Bank (CDCC) | 1 |
| 12 | City Union Bank | 1 |
| 13 | CSB Bank Ltd. | 1 |
| 14 | DBS Bank Ltd. | 4 |
| 15 | Deutsche Bank | 1 |
| 16 | Dhanlaxmi Bank Ltd. | 2 |
| 17 | Doha Bank | 1 |
| 18 | Federal Bank Ltd. | 10 |
| 19 | HDFC Bank | 5 |
| 20 | HSBC Bank Ltd. | 1 |
| 21 | IBL Finance Ltd. | 6 |
| 22 | ICICI Bank Ltd. | 7 |
| 23 | IDBI Bank | 5 |
| 24 | IDFC First Bank Ltd. | 22 |
| 25 | IndusInd Bank | 41 |
| 26 | Inclusion Finance Pvt. Ltd. | 1 |
| 27 | InCred Financial Services Ltd. | 1 |
| 28 | Indian Bank | 5 |
| 29 | Indian Overseas Bank | 21 |
| 30 | IndusInd Bank Ltd. | 2 |
| 31 | Jana SFB | 3 |
| 32 | Karnataka Bank | 1 |
| 33 | Karnataka Vikas Grameen Bank | 1 |
| 34 | Karur Vysya Bank | 1 |
| 35 | Kerala Gramin Bank | 1 |
| 36 | Kotak Mahindra Bank Ltd. | 7 |
| 37 | MUDRA | 3 |
| 38 | NABARD | 1 |
| 39 | Pudhuwai Bharathiyar Grama Bank | 1 |
| 40 | Punjab & Sindh Bank | 1 |
| 41 | Punjab National Bank | 13 |
| 42 | SBM Bank | 1 |
| 43 | Shivalik SFB | 1 |
| 44 | SIDBI | 3 |
| 45 | Standard Chartered Bank Ltd. | 25 |
| 46 | State Bank of India | 26 |
| 47 | State Bank of Mauritius | 1 |
| 48 | Suryodoy SFB | 1 |
| 49 | Tamil Nadu Grameen Bank | 3 |
| 50 | Tamilnad Mercantile Bank | 3 |
| 51 | The Assam Co-operative Apex Bank Ltd. | 1 |
| 52 | UCO Bank | 6 |
| 53 | Union Bank of India | 11 |
| 54 | Unity SFB | 1 |
| 55 | Utkarsh SFB | 2 |
| 56 | Yes Bank | 6 |
Table 4.5.2 (b): List of other lenders who lent to MLIs as of March 2025 (Based on the Top 10 lenders out of the total)
| S. No. | Name of Lenders | No. of MLIs |
|---|---|---|
| 1 | Aditya Birla Finance Ltd. | 3 |
| 2 | AFI Fund - IIV Mikrofinanzfonds | 1 |
| 3 | Agent for Impact (AFI) | 1 |
| 4 | Ajanta Pharma Ltd. | 1 |
| 5 | Alwar General Finance Co. Pvt. Ltd. | 1 |
| 6 | Ambit Finvest Pvt. Ltd. | 1 |
| 7 | Ambium Finserve Pvt. Ltd. | 1 |
| 8 | Annapurna Finance Pvt. Ltd. | 2 |
| 9 | Any Other (Saving mobilization) | 1 |
| 10 | Arohan Financial Services Ltd. | 18 |
| 11 | ASA International N.V. | 3 |
| 12 | Aspire & Innovative Advertising Ltd. | 1 |
| 13 | Assam Financial Corporation | 1 |
| 14 | Avanti Finance Pvt. Ltd. | 5 |
| 15 | Bajaj Finance Ltd. | 3 |
| 16 | BC Co-Operative Partners | 1 |
| 17 | BIFCO Leasing & Finance Pvt. Ltd. | 1 |
| 18 | Blacksoil Capital Pvt. Ltd. | 3 |
| 19 | BlueOrchard Finance Ltd. (BlueOrchard Microfinance Fund) | 7 |
| 20 | Carron Capital Advisors | 1 |
| 21 | Caspian Impact Investments Pvt. Ltd. | 4 |
| 22 | Clime Finance Pvt. Ltd. | 2 |
| 23 | Clix Capital Services Pvt. Ltd. | 2 |
| 24 | Concord | 2 |
| 25 | Credit Saison | 3 |
| 26 | Developing World Markets (DWM) | 1 |
| 27 | Electronica Finance Ltd. | 3 |
| 28 | Enabling Capital Ltd. | 2 |
| 29 | Enabling Capital Trust | 2 |
| 30 | Experimac Finance Pvt. Ltd. | 1 |
| 31 | Financial Institution | 1 |
| 32 | Finhive Capital Pvt. Ltd. | 3 |
| 33 | Finstars Capital Ltd. | 10 |
| 34 | FMO | 2 |
| 35 | Fuehrer Capital Pvt. Ltd. | 1 |
| 36 | FWWB | 15 |
| 37 | Global Access Fund | 1 |
| 38 | GOJO & Co. | 5 |
| 39 | Grip Invest Technologies Pvt. Ltd. | 2 |
| 40 | Group Funding | 1 |
| 41 | Grow Money Capital Pvt. Ltd. | 2 |
| 42 | Hindon Mercantile Ltd. | 5 |
| 43 | Hinduja Leyland Finance Ltd. | 5 |
| 44 | Homeshree | 1 |
| 45 | ICON Financial Services Pvt. Ltd. | 1 |
| 46 | IKF Finance Ltd. | 4 |
| 47 | Jackson Commercial Pvt. Ltd. | 1 |
| 48 | Jalan Chemical Industries Pvt. Ltd. | 1 |
| 49 | Jeevan Utthan Financial Services Pvt. Ltd. | 2 |
| 50 | JM Financial Ltd. | 2 |
| 51 | Kaleidofin Capital Pvt. Ltd. | 5 |
| 52 | Kashi Vishwanatha Vidya Samasthe | 1 |
| 53 | Kiara Micro Credit Pvt. Ltd. | 2 |
| 54 | Kisetsu Saison Finance (India) Pvt. Ltd. | 3 |
| 55 | Kissandhan Agri Financial Services Pvt. Ltd. | 2 |
| 56 | Kiyansh Finance Pvt. Ltd. | 2 |
| 57 | Kula Loans International | 1 |
| 58 | L&T Financial Services Ltd. | 22 |
| 59 | Loan from Directors | 1 |
| 60 | Loan from Directors & Relatives | 1 |
| 61 | Loan from Financial Institution | 1 |
| 62 | Loan from Members & Relatives | 1 |
| 63 | Loan from Promoters & Relatives | 1 |
| 64 | Loan from Shareholders (Unsecured) | 1 |
| 65 | Loans from Promoters | 2 |
| 66 | Manaveeyaa Development and Finance Pvt. Ltd. | 15 |
| 67 | Manba | 1 |
| 68 | MAS Financial Services Ltd. | 20 |
| 69 | Masala Investments Sarl (NCD cum Subdebt) | 1 |
| 70 | Members & Public | 1 |
| 71 | Microfinance Solidaire | 1 |
| 72 | Milap | 2 |
| 73 | MK Venture Capital Pvt. Ltd. | 3 |
| 74 | Moneywise Financial Services Ltd. | 4 |
| 75 | Moringaway | 1 |
| 76 | Muthoot Microfin Ltd. | 3 |
| 77 | N+1 Capital Ltd. | 1 |
| 78 | NABFINS Ltd. | 31 |
| 79 | Nabkisan Finance Ltd. | 5 |
| 80 | Nabsamruddhi Finance Ltd. | 1 |
| 81 | National Co-Op Development Corporation | 1 |
| 82 | National Scheduled Castes Finance and Development Corporation (NSFDC) | 1 |
| 83 | Navachetana Vividodesh Souharda Sahakari Niyamit | 1 |
| 84 | NCD Application | 1 |
| 85 | NCD issued to Promoters and Others | 1 |
| 86 | NDC | 1 |
| 87 | Nederlandse Financierings-Maatschappij voor Ontwikkelingslanden N.V. (FMO) | 1 |
| 88 | NEDFI | 5 |
| 89 | Neeva Swarnam Pvt. Ltd. | 3 |
| 90 | Nipha Finance Pvt. Ltd. | 1 |
| 91 | NKC Finance Pvt. Ltd. | 2 |
| 92 | Northern Arc Capital Ltd. | 20 |
| 93 | Nova Vyapar Pvt. Ltd. | 1 |
| 94 | Others | 5 |
| 95 | Oxyzo Financial Services Pvt. Ltd. | 4 |
| 96 | Pahal Financial Services Ltd. | 1 |
| 97 | Piramal Capital & Housing Finance Ltd. | 3 |
| 98 | Poonawalla Fincorp Ltd. | 3 |
| 99 | Private Finance | 1 |
| 100 | Project Amon SCB (ECB) | 1 |
| 101 | RAI Finance Ltd. | 19 |
| 102 | Real Touch Finance Ltd. | 8 |
| 103 | ResponsAbility | 2 |
| 104 | Retail Investor | 1 |
| 105 | Ricavi Finance Ltd. | 3 |
| 106 | Rockland Finstock Ltd. | 2 |
| 107 | Rotary Fund | 1 |
| 108 | Samanthah Finance Ltd. | 2 |
| 109 | Samunnati Financial Intermediation & Services Pvt. Ltd. | 9 |
| 110 | SAS Finserv Pvt. Ltd. | 1 |
| 111 | SAS Infotech (inter corporate loan) | 1 |
| 112 | Save Solutions Pvt. Ltd. | 2 |
| 113 | Saving & Deposit from Borrowers/Public | 1 |
| 114 | Share Bazar Financial Services Ltd. | 1 |
| 115 | Shine Star Build Cap Pvt. Ltd. | 6 |
| 116 | Shriram Finance Ltd. | 15 |
| 117 | SMC Finance (Moneywise Financial Services Pvt. Ltd.) | 1 |
| 118 | Subhsherse Tradelink Pvt. Ltd. | 1 |
| 119 | Sumitomo Mitsui Banking Corporation | 1 |
| 120 | Sundram | 1 |
| 121 | Symbiotic AAV SARL and MIS SARL | 1 |
| 122 | Symbiotics South Asia Pvt. Ltd. | 2 |
| 123 | Tamilnadu Industrial Investment Corporation Ltd (TIIC) Ltd. | 1 |
| 124 | Tarangini Commercial Enterprises Ltd. | 2 |
| 125 | Tata Capital Financial Services Pvt. Ltd. | 4 |
| 126 | Tipsons Consultancy Services Pvt. Ltd. | 1 |
| 127 | Triple Jump | 4 |
| 128 | UC Inclusive Credit Pvt. Ltd. (UCIC) | 12 |
| 129 | United States Development Finance Corporation (DFC) | 1 |
| 130 | Usha Financial Services Pvt. Ltd. | 17 |
| 131 | Utthejana Trading and Services Pvt. Ltd. | 1 |
| 132 | Vedika Credit Capital Ltd. | 3 |
| 133 | Venus India Asset-Finance Pvt. Ltd. | 1 |
| 134 | Vivriti Asset Management Pvt. Ltd. | 17 |
| 135 | Western Capital Advisors Pvt. Ltd. | 12 |
| 136 | Whole Planet Foundation | 2 |
| 137 | Yunus Social Business Fund Bengaluru | 1 |
4.5.3 Capital to Total Asset Ratio
The Capital Adequacy Ratio (CAR) represents the ratio of an institution’s capital to its riskweighted assets, ensuring that MFIs can absorb losses and continue operations during stress. The Reserve Bank of India (RBI) mandates that NBFC-MFIs maintain a minimum CAR of 15%, with at least 10% as Tier I capital. This requirement ensures MFIs maintain adequate equity strength despite their reliance on unsecured lending. A strong CAR not only enhances resilience against credit risk but also instils confidence among lenders, investors, and regulators. For MFIs, compliance with CAR norms is essential to secure funding, expand outreach, and maintain long-term sustainability in a sector vulnerable to repayment shocks. Figure 4.5.11 indicates the median CAR for various MLI segments.
Figure 4.5.11: Capital to Risk-Weighted Asset Ratio


4.5.4 Leverage / Debt – Equity Ratio
The Debt-Equity ratio measures the extent to which MFIs finance their assets through borrowed funds compared to shareholders’ equity. Since MFIs primarily operate by mobilising debt from banks, NBFCs, and capital markets, a higher ratio reflects greater reliance on external borrowings. While leveraging debt helps expand outreach and scale loan portfolios quickly, excessive dependence on debt increases financial risk and vulnerability to interest rate fluctuations. Regulators and lenders often prescribe prudent debt-equity thresholds to ensure stability. Figure 4.5.12 depicts the median Debt-Equity ratio across segments.
Figure 4.5.12: Debt - Equity Ratio Trend and Break–up of FY2024-25 across MLI – Categories

Conclusion
The balance sheet and capital structure of Microlending Institutions (MLIs) reflect both their resilience and the challenges faced in a rapidly evolving regulatory and economic environment. The adoption of IndAS and principle-based auditing standards has improved transparency, accountability, and governance, while also increasing the responsibilities of auditors to assess qualitative aspects of financial management. Assets remain central to MFI operations, with loan portfolios driving income and other asset classes ensuring liquidity and stability. However, FY2024-25 witnessed a contraction in total assets, primarily due to a decline in lending portfolios, highlighting the sector’s vulnerability to external shocks.
On the funding side, both equity and debt flows showed significant declines, indicating cautious investor and lender sentiment. Equity outstanding continues to provide a foundation of financial strength, but the amount of fresh equity raised fell by nearly 28%, reflecting investor selectivity. Debt funding and borrowings also contracted sharply, driven by tighter credit, rising costs, and concerns over asset quality. These developments underscore the importance of prudent leverage, robust net owned funds, and compliance with CAR norms to ensure financial stability. In the future, MLIs must strike a balance between growth and risk management, strengthen stakeholder confidence, and diversify funding sources to sustain inclusive financial services.


